
Spend Management in Procurement Operations
Average procurement teams manage 70% of spend; best-in-class manage 90%.
The gap that defines spend management performance
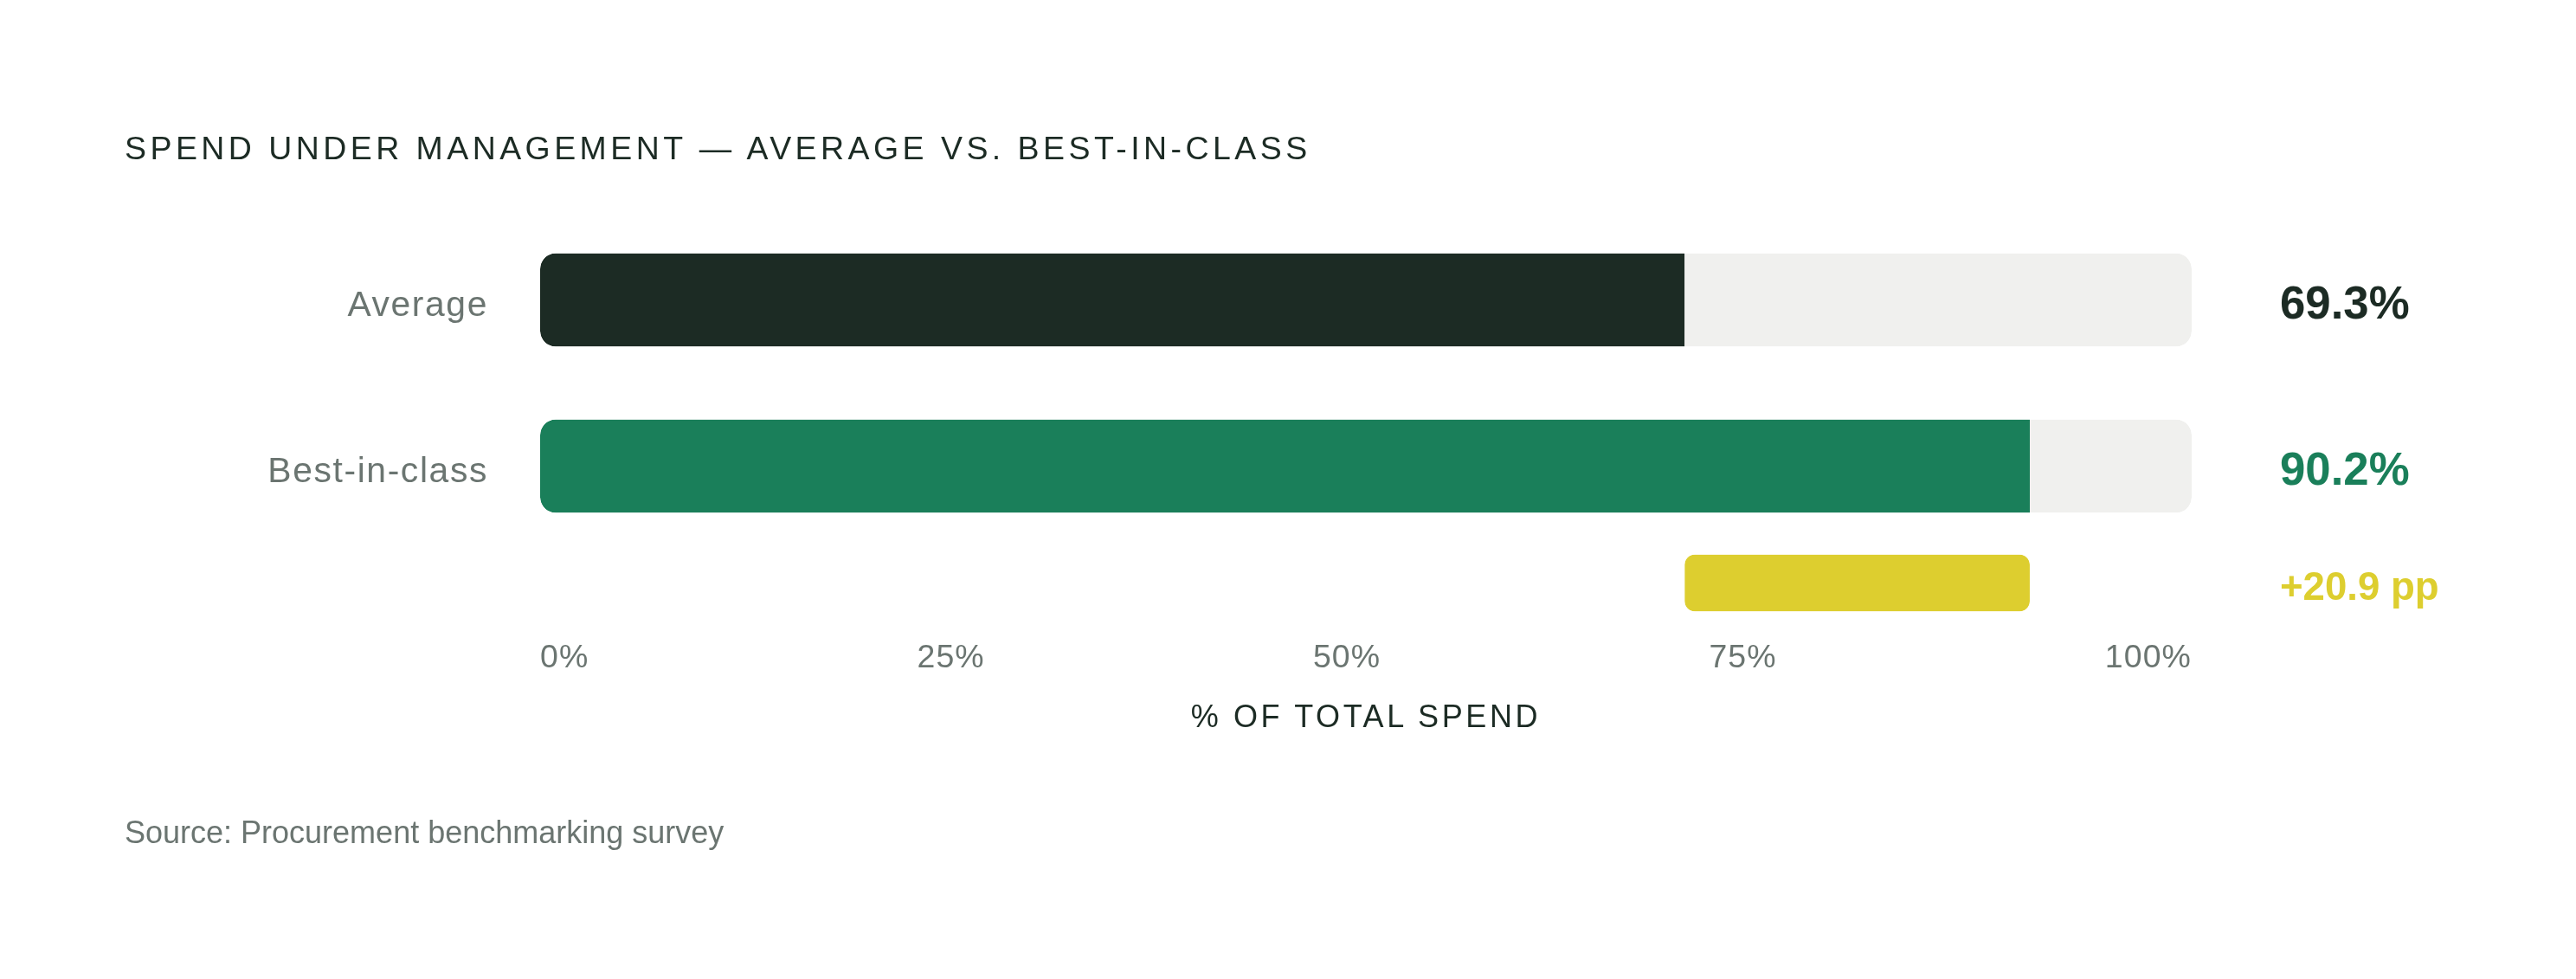
The average procurement organization manages 69.3% of its spend. Best-in-class teams manage 90.2%. That's roughly a 20-point gap, structural, because visibility, categorization, policy, and supplier control all leak a little, and those small leaks add up to a chasm.
This piece maps the discipline itself, so a procurement or finance lead can see exactly which layer is springing a leak. Workloads are climbing roughly 10% while budgets creep up maybe 1%, and that gap is not a technology gap — it is a structural one: visibility, categorization, policy, and supplier control all contribute Procurement Statistics — 60 Key Figures of 2026 SaaS Procurement Predictions for 2026 - Tropic.
What spend management covers in a procurement operation
Spend management gets treated like one thing, a dashboard, maybe, or a rule that says "get three quotes." It isn't. It spans visibility, categorization, policy enforcement, supplier control, and payment integrity, stretched across the entire procure-to-pay cycle. Skip a layer and the whole chain stays weak, the way a fence with one missing post still lets the dog out.
Procurement, accounts payable, and spend management are terms people mix up constantly. Procurement is the big-picture function of sourcing, contracting, and supplier relationships; accounts payable is the downstream execution after commitments are made; and spend analytics is just a reporting layer inside spend management, one instrument on the dashboard, not the whole operation.
The theme running through 2026 procurement research is blunt: build one connected process instead of automating a pile of disconnected steps. Plenty of teams have sped up approvals and pushed more invoices through the pipe, and still have no proactive controls and no real centralized visibility. Faster is not the same as smarter. The four layers developed here are visibility, categorization paired with policy, supplier control, and measurement. Each one is necessary. None of them, alone, gets the job done.
Spend visibility: what it means to see your spend before it happens
Seeing an invoice after it lands in the inbox is an autopsy: the money's already spent, the decision's already made, and all that's left is filing it correctly.
Real visibility means tracking spend across several layers at once, before the commitment locks in. That includes pending demand (requests submitted but not yet approved), committed spend (POs and contracts already signed), actual spend (the invoices and completed purchases), and forecasted obligations (the renewals and ongoing commitments already baked into next quarter). Line those four up next to each other, and suddenly procurement can act instead of react: combine pending demand across departments for bulk pricing, catch a duplicate before it's paid twice, get ahead of a renewal instead of scrambling the week it auto-renews.
The better question isn't "how much did we spend." It's whether there's still time to change what's about to happen.
This is where it gets structurally messier: lines of business and individual employees are now responsible for buying roughly 84% of spend and 87% of applications, and decentralization doesn't just make the visibility problem bigger, it makes it harder to even locate SaaS Procurement Predictions for 2026 - Tropic. The usual suspects showing up in this shadow spend, tools that teams quietly expense without procurement ever seeing the request, include OpenAI, LinkedIn, Figma, GitHub, Adobe, Calendly, Canva, Twilio, Atlassian, Zapier, and JetBrains. Recognizing a few of those from your own company card statement is the point.
Add to that the fact that spend itself is getting less predictable. Suppliers running on consumption-based pricing, Datadog and Twilio among them, show significantly higher spend variance than fixed-cost vendors. Visibility isn't just about finding the spend anymore. It's about watching a number that won't sit still.
Spend categorization: why classification quality determines everything downstream
Visibility gets you the data. Categorization is what turns that pile of data into something a human can actually act on. Skip it, and you've just got a bigger, messier spreadsheet.
The failure modes are familiar to anyone who's opened a general ledger. Spend is recorded in default GL codes that don't reflect what was actually bought. The same vendor shows up under three different spellings across three different systems because nobody standardized the supplier name field. And tail spend, the long list of small, one-off purchases, gets left uncategorized entirely because no single transaction looks big enough to bother with, even though the total adds up to a real number.
AI is getting thrown at this problem constantly now, but 73% of organizations say data quality is the barrier to AI actually working: fed messy, inconsistent categorization, a model doesn't clean up the mess, it learns it and repeats it faster. Data and process maturity need to be a prerequisite for AI adoption, not a side project bolted on afterward; plenty of teams skip that step, conclude "AI doesn't work for us," and never realize the real problem was the data they handed it.
So before shopping for an AI classification tool, ask the boring questions first. Are purchase orders standardized? Are approvals documented anywhere consistent? Can a purchase be traced back to the request that started it? Is supplier data duplicated across systems? None of that is glamorous. All of it determines whether the AI layer helps or just automates the chaos. The spend analytics market is growing at close to 17.9% a year through the back half of the decade, which tells you plenty of organizations have already figured out this layer isn't optional SaaS Procurement Predictions for 2026 - Tropic.
Policy enforcement and demand management: controlling spend before it is committed
By the time most procurement teams get involved, the business has already decided what it wants, so the conversation is stuck arguing over which supplier, what price, what terms, while most of the actual cost opportunity has already left the building.
Real demand management means procurement stepping in earlier and asking harder questions. Does this purchase need to happen? Is the timing right? Is there already a contract sitting somewhere that covers this exact need? Policy enforcement, done right, isn't a checkpoint that flags bad spend after it happens, but a request-to-pay flow designed so out-of-policy spend has a hard time getting initiated in the first place, not just caught on the way out.
Three-way matching, checking the purchase order against the goods receipt against the invoice, is table stakes: it confirms order, delivery, and bill match, but doesn't stop unauthorized demand from entering the system in the first place. It's a floor, and treating it like a ceiling is how "we have controls" turns into "we have controls that catch problems after the money's gone."
The market for orchestration platforms was valued at $8.4 billion in 2025 and is projected to expand to $18.7 billion by 2033. It's not about bolting on another piece of software, but redesigning how context reaches the decision-maker at the moment they need it.
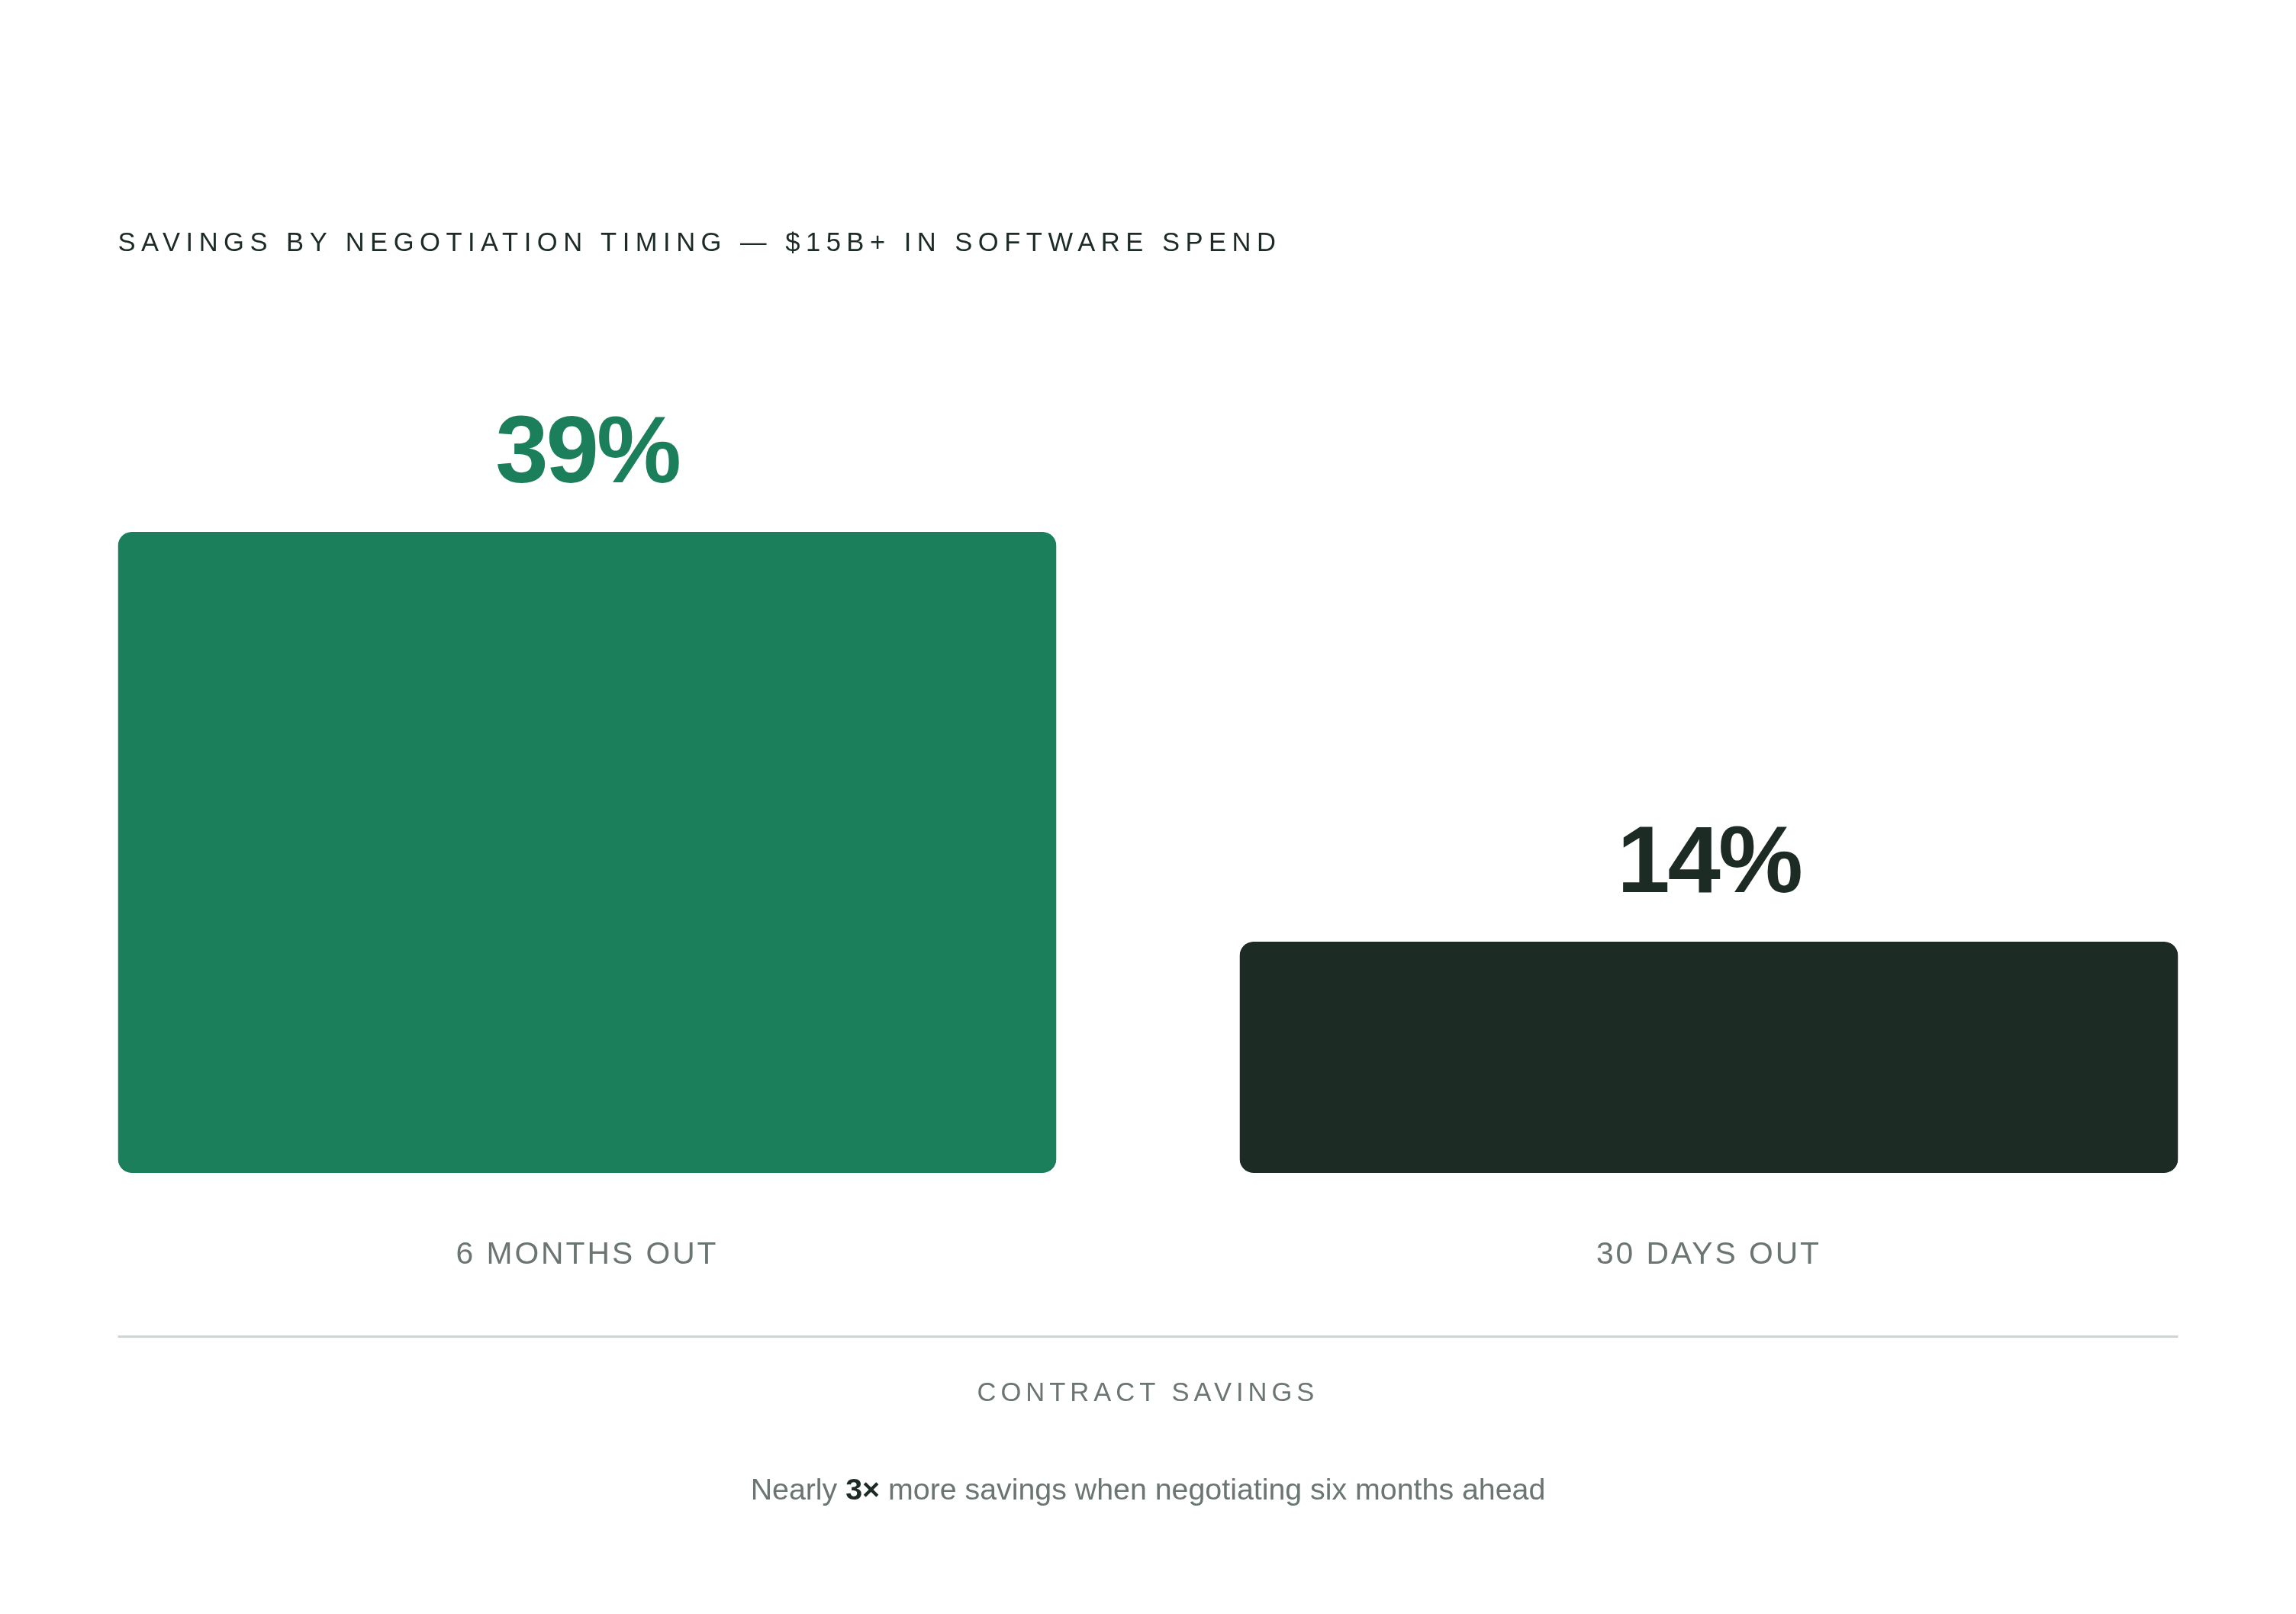
Timing itself is an underused policy lever, a scheduling decision that belongs in policy, not a tips-and-tricks memo. Per Tropic's analysis of over $15 billion in software spend, companies negotiating 6 months ahead save up to 39% more vs. 14% for those starting 30 days out.
Supplier management and contract control as spend management infrastructure
Supplier management doesn't sit next to spend management, it sits underneath it: a supplier relationship nobody's actively managing produces spend nobody's actively managing.
Contract terms and renewal timing matter more than they get credit for. Average new contract length climbed to 15.1 months in 2025, which changes how often a team needs to be paying attention versus how often they can safely look away. ESG reporting requirements are expected in roughly 69% of new supplier agreements signed in 2026, and cybersecurity clauses in around 64% of contracts, becoming standard contract architecture Top 10 Procurement Trends in 2026.
Vendor risk doesn't wait for the annual review: Carta, Zendesk, Google Workspace, and Greenhouse all dropped off most-used tools lists within a single year, and a supplier's risk profile can shift in the time it takes to renew a lease on an apartment. And with consumption-based pricing from vendors like Datadog and Twilio, procurement needs to negotiate for elasticity, price caps, volume thresholds, renegotiation triggers, rather than betting on a fixed number holding steady for the life of the contract.
Consolidation belongs here too: legacy collaboration tools like Slack and Zoom are seeing adoption pull back as teams rationalize their stacks around actual return. That's not IT tidying up a junk drawer, it's supplier management doing its job. More suppliers means more contracts, which means more exceptions, which means more places for the number to quietly erode.
Where AI fits into spend management and its data quality limits
AI adoption in procurement is no longer a future-tense conversation: over 80% of organizations expect to actively fold predictive analytics and AI into procurement by 2026, and 94% of procurement executives use generative AI tools weekly.
Adoption and effectiveness, though, are different animals: roughly 47% of operations leaders cite integration complexity as the main reason technology investments haven't fully paid off. Where AI is genuinely earning its keep right now: spend classification at scale, contract drafting and language generation, supplier research and risk flagging, and prepping renewal recommendations and negotiation angles. The direction points further still, toward systems that draft contract language, generate negotiation recommendations, and execute renewals within preset policy limits on their own. About 64% of procurement leaders expect AI and GenAI to reshape their roles within five years.
None of that erases the sharpest point in this piece: 73% of organizations cite data quality as the barrier to AI actually working. Run AI on a bad data foundation and the result is a bigger mistake, made with more confidence. Which is exactly why AI systems making autonomous spend decisions need guardrails that procurement teams themselves define and sign off on, not open-ended automation left to run unsupervised. The procurement leaders who come out ahead here won't be the ones chasing every new feature release. They'll be the ones who made sure the data underneath was solid before turning the automation loose.
Average spend on AI-native apps grew 108%, leaving procurement teams stuck managing spend on the very category of tool meant to help them manage spend.
How best-in-class programs measure spend under management
Spend under management is the headline metric everyone quotes, but it's often reported in a way that tells you almost nothing, because a percentage without its denominator (the total addressable spend) hides exactly where the gaps sit.
The Ardent Partners benchmark works precisely because it avoids that trap: 69.3% average against 90.2% best-in-class, measured against a defined population. That's evidence that holds up when someone pokes at it.
Most teams get tripped up predictably: spend gets counted as "managed" the moment a PO is issued, even after the commitment was already made; whole categories like SaaS, travel and expense, and contingent labor get quietly excluded from the denominator, inflating the reported number without anyone technically lying; and SUM gets reported annually, though the gap between committed and actual spend moves far faster.
Deep, real-time data visibility is flagged as one of the factors expected to drive the biggest transformational impact on procurement going forward, and periodic reporting simply can't reveal problems the way continuous measurement does. The spend analytics market's climb toward 17.9% annual growth through 2030 is a decent proxy for how seriously organizations are starting to take this.
Good measurement, done properly, tracks SUM by category, by business unit, and by spend type, contracted versus maverick versus tail, not as one aggregate number dropped into a quarterly deck. If procurement staff are overriding AI recommendations constantly, that points to something deeper than a training problem or a change-management hiccup. That's the data quality problem from earlier sections, resurfacing in a new spot.
The platform layer: tools that support spend management and criteria for evaluating them
The procurement software market is a crowded one, and getting more so. It's expected to reach $9.5 billion by 2028, growing at roughly 7.6% a year. Named players include Coupa, SAP Ariba, Ivalua, JAGGAER One, GEP SMART, Oracle Fusion Cloud Procurement, Basware, Zycus, Vroozi, and Zip, each worth evaluating on AI capability, ERP integration, finance's actual usability, and implementation pain. A bigger market means more options, not automatically clearer choices, and the newest logo isn't necessarily the best fit.
Run any candidate platform against the five layers this piece has walked through. Does it show pending demand and forecasted obligations, or only actuals after the fact? How does it handle spend that hasn't been categorized yet, and what condition does the underlying data need to be in before its AI classification is trustworthy? Can it stop out-of-policy spend before it's committed, or does it only flag the exception once the damage is done? And does it report spend under management by category and business unit, or hand back one aggregate figure and call it a day?
Technology, by itself, closes none of this gap; the 47% of operations leaders citing integration complexity as their top barrier to ROI applies here. Top-quartile CPO teams plan to put around 24% of their budget toward technology by 2026, a meaningful commitment, but that still leaves roughly three-quarters of even a top-performing budget on people, process, and governance, the unglamorous parts nobody puts on a conference slide.
Procurement teams increasingly research vendors through AI chatbots before ever talking to a sales rep, with 94% of B2B buyers reporting they used AI somewhere in their most recent purchase process. Tracking whether a brand actually gets cited by name in those AI-generated answers, not just where it lands in a traditional search result, is becoming its own line item in the evaluation stack.
Why most spend management programs stall between 70% and 80%
Line the layers up and the stall point stops being mysterious: visibility showing only actuals, categorization on inconsistent data, policy that flags rather than prevents, unrationalized supplier sprawl, and measurement as one flat annual number can each cap a program around 70 to 80%.
Closing the last 20 points isn't a single project with a single owner, since visibility, categorization, policy, and supplier control all contribute to that gap; it's why the gap between 69.3% and 90.2% has held steady long enough to become the defining number in this field. Fix categorization without fixing policy, and better data just describes the same leaks more accurately. Fix policy without fixing supplier control, and the enforcement has nothing solid to stand on. They're the ones that stopped treating these five layers as separate projects and started treating them as one operation.
Sources
- SaaS Procurement Predictions for 2026 - Tropic
- Top 10 Procurement Trends in 2026
- Procurement Statistics — 60 Key Figures of 2026
- Procurement Benchmarks 2026: Compare Your KPIs to $30B+ Spend Data
- Procurement Trends 2026: Key Data, Priorities, and Pitfalls | Suplari
- Spend Management Explained: The 7-Step Framework Finance Teams Need in 2026
- Spend Under Management in Procurement: Unlock ROI & Savings
- 70+ SaaS Statistics for 2026 (Spend, Usage & Waste) | Zylo

