
Spend Management Reporting and Analytics
Unified spend data across finance, IT, and procurement prevents budget surprises.
Spend management reporting fails for a boring reason: most companies are measuring the wrong thing, or measuring the right thing in four different systems that don't talk to each other. The result is finance running one set of numbers, IT running another, and procurement walking into negotiations with a third. Good reporting works across four distinct layers, visibility, categorization, utilization, and forecasting. Skipping any one of them leaves money on the table, renewals on autopilot, and budget conversations stuck in a loop of "whose data is right?" It also covers why the structural shift toward decentralized buying, shadow IT, consumption-based pricing, and AI-native tools has made this harder than it used to be, and what to look for in a platform that actually handles all four layers at once.
Why spend visibility keeps breaking
Nobody's asleep at the wheel here. Companies are missing spend data because purchasing decentralized faster than anyone built the guardrails to track it.
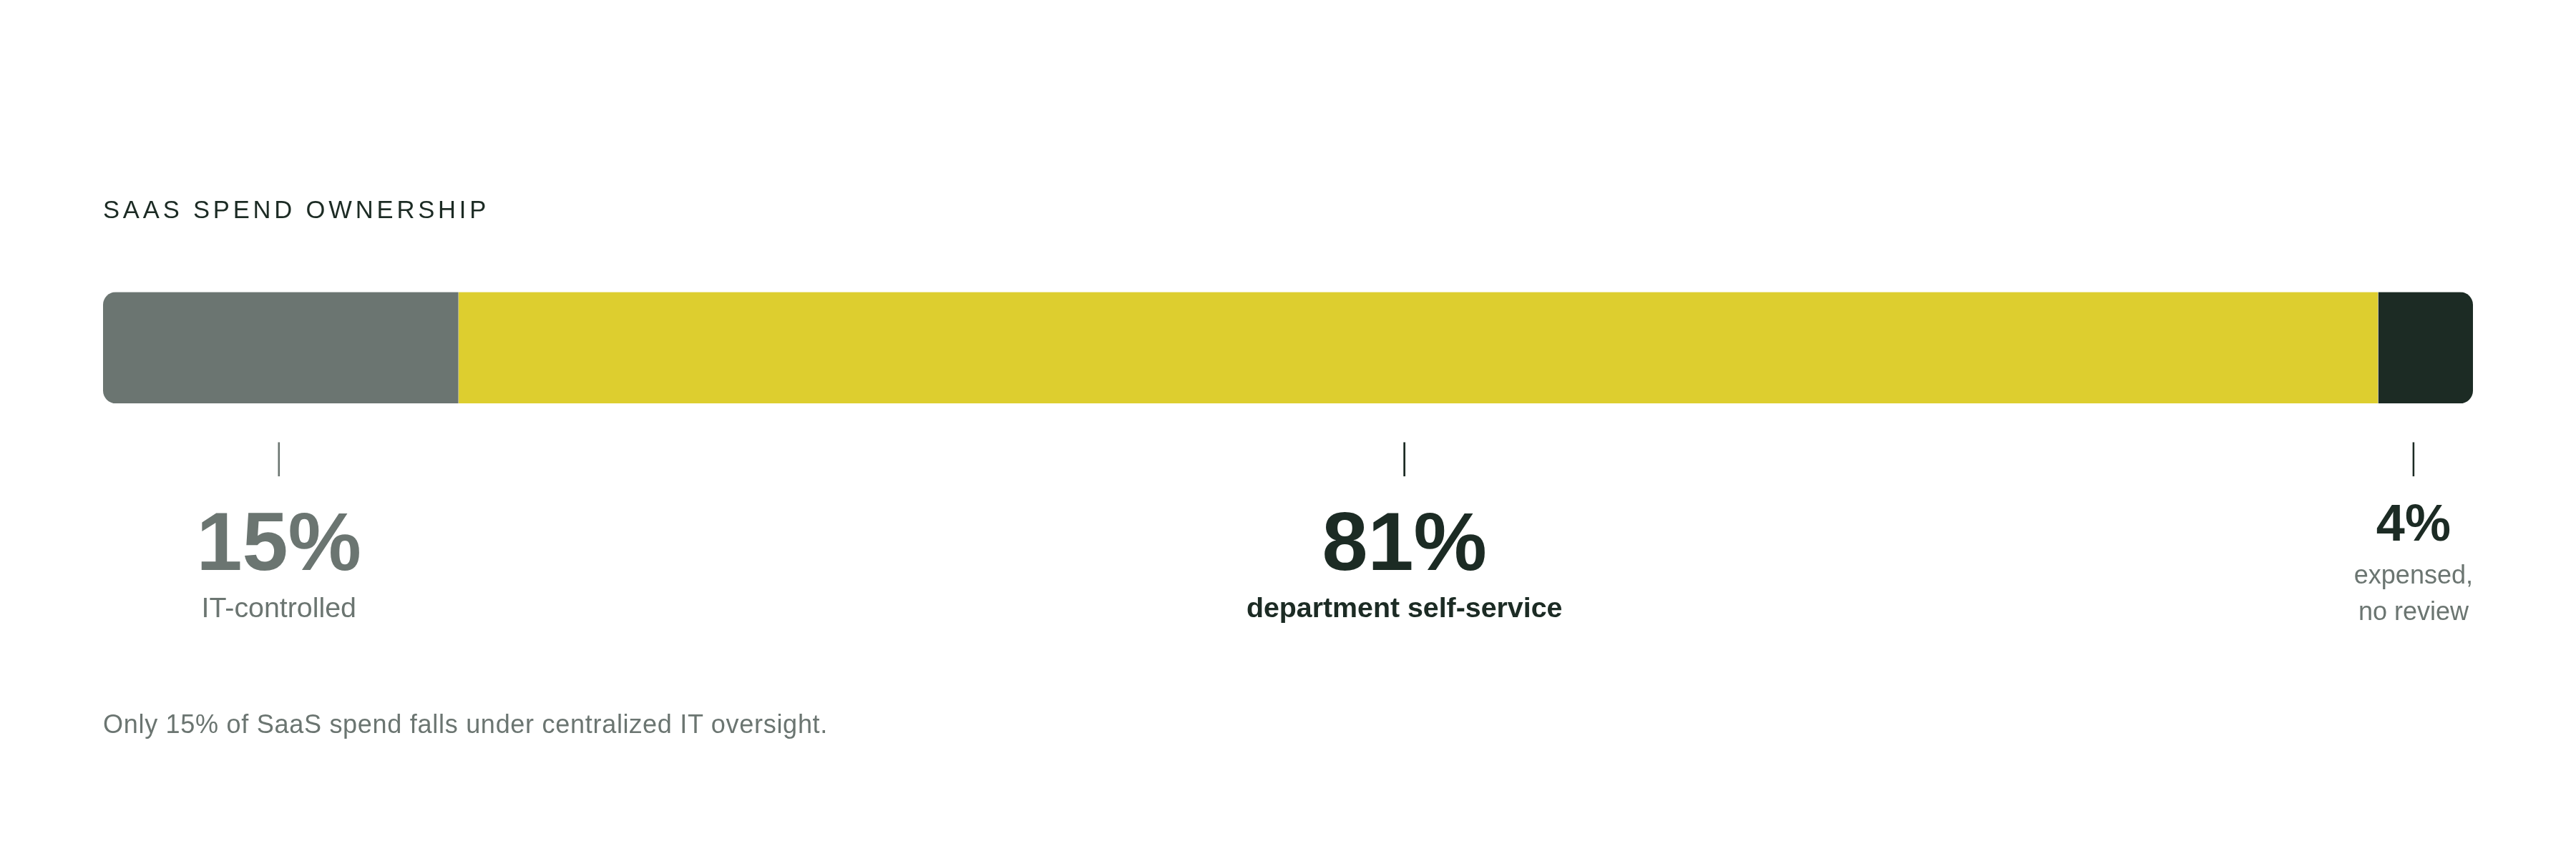
IT now controls about 15% of SaaS spend directly. The rest, roughly 81%, sits with individual departments making their own buying calls, and another 4% or so comes from employees expensing tools on a personal card with zero central review. That's most of the budget living outside the system meant to track it.
The fallout appears fast. Something like 78% of IT leaders report getting hit with charges they didn't see coming, usually tied to consumption-based or AI pricing tiers that scale with usage instead of a flat seat count. And 61% have had to cut a project midstream because SaaS costs jumped without warning. Most organizations can't account for around 40% of what they're actually spending. That money is hiding in shadow IT, scattered department budgets, and renewals that nobody flagged in time.
What good reporting actually does
Assuming more dashboards means better visibility is a common mistake. More data sources, more granularity, more charts to scroll through. None of that matters if a finance director still can't answer "should we renew this?" in under ten minutes.
Good reporting does four specific jobs, and each one is a different problem wearing the same trench coat:
Surface what exists (that's an inventory problem)
Explain what it is (a classification problem)
Show whether anyone's using it (a waste problem)
Predict where it's headed (a planning problem)
Treating those four as one blurry task produces a dashboard that half-answers everything and fully answers nothing. Worse, the three teams who need this data want different things from it. Finance cares about variance and forecast accuracy. IT wants to know who owns what and whether it's being used. Procurement needs contract timing and leverage for the next negotiation. One shared data source has to serve all three, or each team ends up building its own spreadsheet and arguing about whose number is right.
Visibility: know what you're paying for
Visibility reporting is active detective work, going after spend that never made it into any system of record, uncovering the subscriptions someone forgot to log.
Where does that invisible spend hide? A few usual suspects: shadow IT bought on a personal card and expensed after the fact, renewals set to auto-renew with nobody assigned to review them, AI features that quietly activate inside a tool the company already pays for (no new contract, no new approval, just a cost that appears), and consumption-based charges that build up between billing cycles with no real-time alert.
Catching all of that means pulling data from financial systems, SSO providers, expense platforms, HRIS records, and direct integrations with the applications themselves. That's not overkill. The average company juggles a large and growing application portfolio, with renewals coming due constantly throughout the year. At that volume, a manual spreadsheet isn't a system, it's a wish.
Categorization: turn inventory into usable data
A list of every tool a company pays for is useless on its own. It tells you what exists, not how to compare it, budget for it, or govern it. That's what categorization is for.
The useful splits are by department (who actually owns the spend), by vendor category (collaboration, security, analytics, AI-native, and so on), by pricing model (seat-based, consumption-based, hybrid, outcome-based), by cost center for finance to reconcile against budget, and by risk tier for anything touching sensitive data.
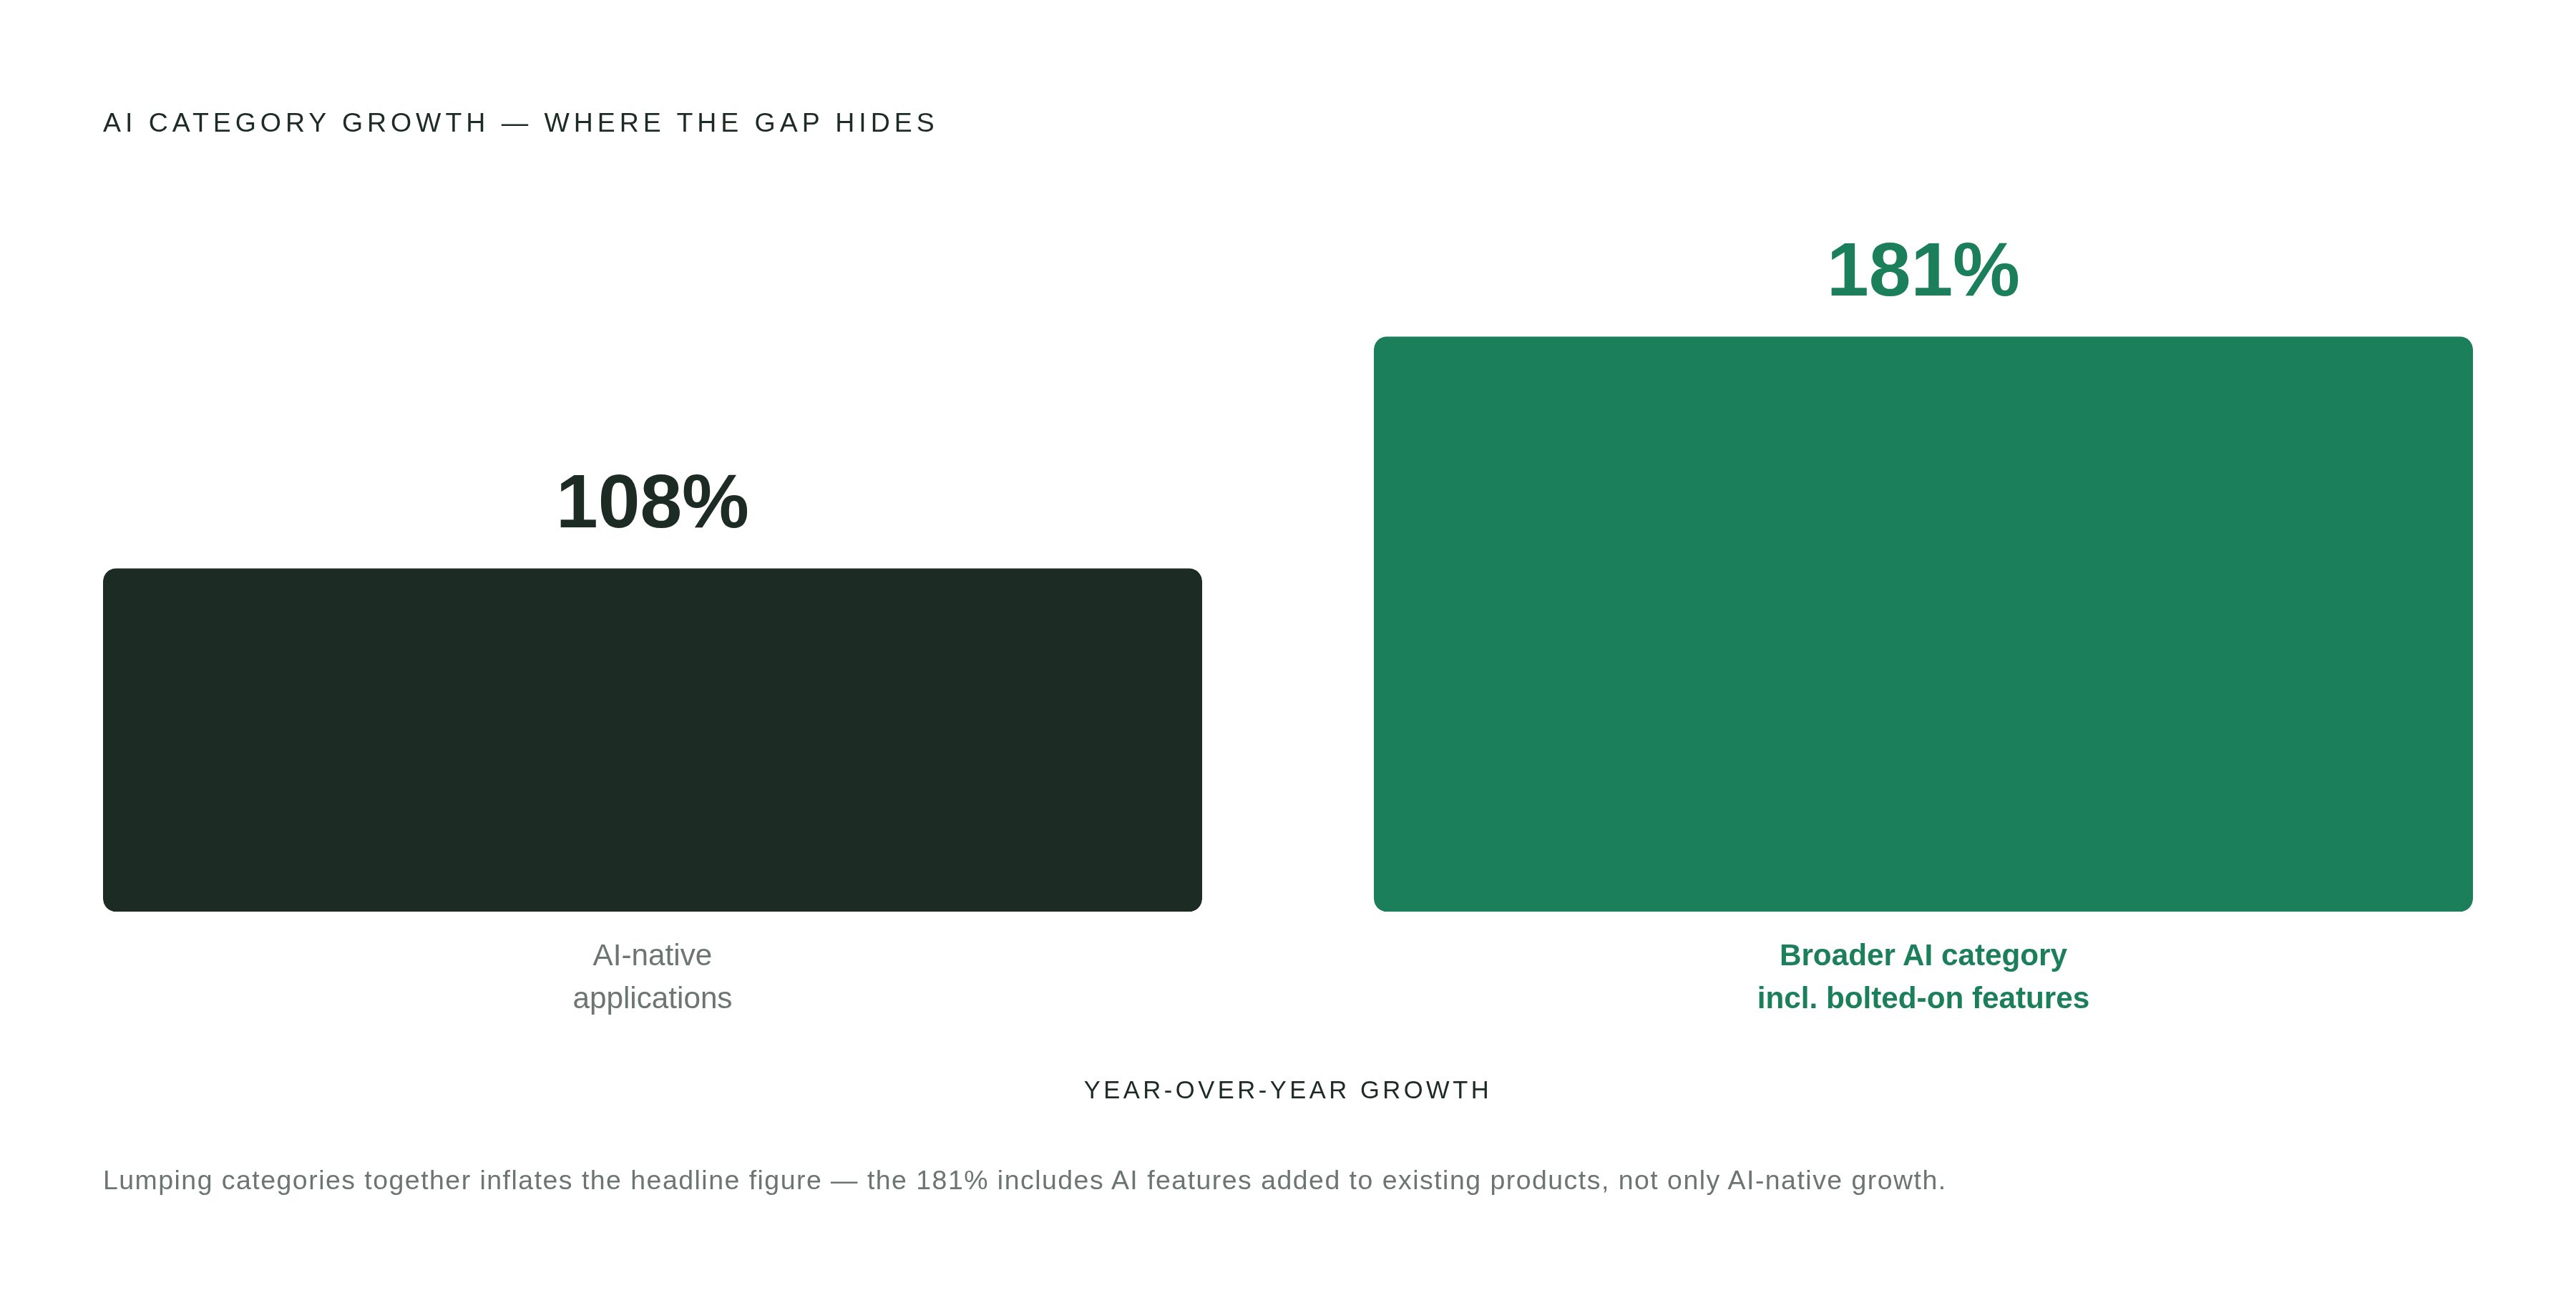
Spending on AI-native applications, the ones where AI is the whole product, jumped 108%, a pricing-model split that changes how finance teams must track costs. But applications across the broader AI category (including AI features bolted onto existing tools) grew 181%. Lump those two together and a finance team loses the ability to see which cost curve is actually accelerating. They look similar on a chart. They are not the same problem.
Categorization also does something sneaky useful: it turns maverick spend detection from a quarterly fire drill into a background process. Classify every transaction as it comes in, and anything that doesn't match an approved vendor or policy just falls out on its own. No audit required. No angry email chain in March asking who bought what in October.
Utilization: paid for versus actually used
A contract says 500 seats. Fine. How many of those seats belong to an actual, named human being who logged in this month? Nobody knows, because in a decentralized buying environment, nobody's watching.
That gap is expensive. Eliminating unused licenses and duplicate tools doing the same job in two different departments can recover a meaningful share of total SaaS spend. That's not a marginal win, that's real money sitting in plain sight.
Utilization reporting runs the same four questions on every application: how many licenses are under contract, how many are assigned to a real person, how many of those assigned users actually logged in during a 30, 60, or 90-day window, and whether a different department is already paying for something that does the exact same thing. Consumption-based pricing tacks on a fifth question, and it's the one that keeps finance teams up at night: is usage tracking above or below the next pricing tier, and does it make more sense to eat the overage or downsize the plan before the next billing cycle hits?
Forecasting: make reporting predictive, not descriptive
Predictive analytics is the fastest-growing piece of the spend analytics market right now, and the reason isn't complicated. Enterprises don't just want to know what they spent last quarter. They want to know what's coming, catch anomalies before they compound, and make a procurement call with enough runway to actually negotiate.
Forecasting needs real inputs to work, not guesswork. That means historical spend broken out by vendor, category, and cost center (which only exists because the visibility and categorization layers did their job first). It means a renewal calendar with visibility at 90, 60, and 30 days out. It means current utilization numbers, so a renewal decision reflects whether the tool is actually earning its keep. It means benchmark pricing data to sanity-check whether a renewal increase is fair or padded. And increasingly, it means tracking AI and consumption-based pricing tiers specifically, since those are now the line items with the widest swings.
CFOs are voting with their budgets here. Cloud-based planning, budgeting, and forecasting tools topped the list of technology investments in Deloitte's Q1 2026 CFO Signals survey, named by 43% of respondents. That's a C-suite priority with a number attached to it.
Real-time anomaly detection is what separates a forecast that actually adjusts from one that just writes a eulogy after the fact. Flagging an out-of-policy charge the day it happens beats finding it three weeks later buried in a monthly report, by which point the money's already spent and the only thing left to do is write an incident summary nobody enjoys reading.
Where all four layers break down
Finance, IT, and procurement often pull from three separate systems and produce three separate reports. Same vendor, three different numbers, and a meeting that goes nowhere because nobody's arguing from the same spreadsheet.
ITAM and FinOps convergence affects reporting accuracy directly. Both functions depend on the same usage data and the same system of record. Keep them siloed, and reporting doesn't just get messy, it produces contradictions nobody can resolve, because there's no single owner accountable for the decision.
Traditional FinOps was built for cloud infrastructure costs, and it doesn't map cleanly onto SaaS spend anymore, especially as SaaS shifts toward consumption-based and AI-driven pricing. The vocabulary's different. The reporting cadence is different. Trying to force cloud-era FinOps tooling onto SaaS spend is like using a wrench to hammer a nail, technically an object, wrong for the job.
What actually breaks when nobody owns this end to end? Renewals sail through on autopilot because the person managing the renewal calendar has never seen the usage data. Finance builds a forecast off contracted spend, then finds out at month-end that actual spend ran higher because of consumption overages nobody flagged in time to act on. And procurement walks into a renewal negotiation with no utilization evidence in hand. They're negotiating blind and probably leaving money on the table.
What to look for in a platform
Matching a platform to these four layers isn't hard once you know what to check for. Prioritize automated discovery that pulls from financial systems, SSO, expense platforms, and HRIS, not just a manual import (that's the visibility layer). Look for smart classification that keeps updating the taxonomy over time instead of a one-time setup that goes stale in six months (categorization). Look for license utilization tracking down to the seat and feature level, including consumption-based usage (utilization). Look for a renewal calendar with proactive alerts and contract-level forecasting baked in (forecasting). And look for benchmark pricing data, so a team can tell whether a renewal quote is reasonable or a stretch.
Above everything else: one system of record that finance, IT, and procurement can all read, not three separate modules exporting three separate exported files that someone has to reconcile by hand.
A few names in this space, drawn from Zylo's June 2026 roundup of SaaS spend management software, include Zylo, Zluri, CloudEagle, Vendr, BetterCloud, Lumos, Torii, FlexeraOne, and ServiceNow SAM Pro. Tropic's August 2026 buyer's guide on spend analytics highlights its own platform, citing a substantial volume of spend intelligence, an average savings rate of 15.5%, and $56 million in verified savings on $362 million negotiated in the first half of 2025, with initial insights available in 4 to 6 weeks and the platform built to serve procurement and finance at the same time. The same guide describes Coupa as a full-featured enterprise option, though one that typically needs 6 to 12 months of professional services to get fully implemented.
Categorizing by pricing model has stopped being a nice-to-have. With AI-native and AI-embedded tools fragmenting how software gets priced, seat-based, consumption-based, hybrid, outcome-based, tracking both what's purchased and how it's priced is what lets a team catch cost volatility before it appears as a surprise line item. Letterbrace is one platform built around that idea, pairing categorization with forward-looking analytics to flag mid-contract escalations and consumption spikes as they happen, rather than after the invoice lands. Whichever platform a team picks, the test is the same one from the start of this piece: can someone look at the report and actually make a decision, or are they just staring at a nicer chart of the same confusion?

