SG&A Formula Calculation and Component Breakdown
Add selling, general, and administrative costs correctly to read overhead.
- Written by
- Leila Vidal
- Published
- November 9, 2026
- Reading time
- 9 min read
- Sources cited
- 1 sources ↓
What this covers
SG&A, short for selling, general, and administrative expenses, is the set of costs a company incurs to sell its products, maintain its facilities, and run the business, excluding the direct costs of producing goods or delivering services. SG&A calculation is simple addition, but it only works when every cost is placed in the right bucket. The formula combines selling, general, and administrative expenses, and its value comes from separating those costs accurately from production costs and other operating expenses. SG&A sits between gross profit and operating income on the income statement, so it shapes how much of each revenue dollar remains as operating profit. Investors, lenders, and managers use the total and the SG&A ratio to judge operating efficiency, compare companies, and decide where spending should change. This post explains what SG&A includes, how to calculate it, what to exclude, how the ratio varies by industry and company stage, and how fixed and variable costs affect what the ratio reveals.
What SG&A Is and Where It Appears
After the cost of goods sold, or COGS, much of a company's spending goes to winning customers, maintaining facilities, and running the back office. Those costs make up selling, general, and administrative expenses, usually shortened to SG&A. They support the business without directly producing its goods or delivering its services.
SG&A appears below gross profit and above operating income on the income statement. Gross profit is revenue minus COGS, and operating income is gross profit minus operating expenses, which include SG&A. Two companies with identical gross margins can report very different operating income because one controls these expenses and the other does not.
The nearby terms need firm boundaries. COGS covers the direct costs of production or service delivery and sits above gross profit, outside SG&A. G&A means general and administrative expenses, so it is a subset of SG&A. Operating expenses include more than SG&A, with R&D, depreciation, and other operating lines that are reported separately. Most public companies report R&D separately so investors can see that investment independently.
The Core Formula and Its Three Buckets
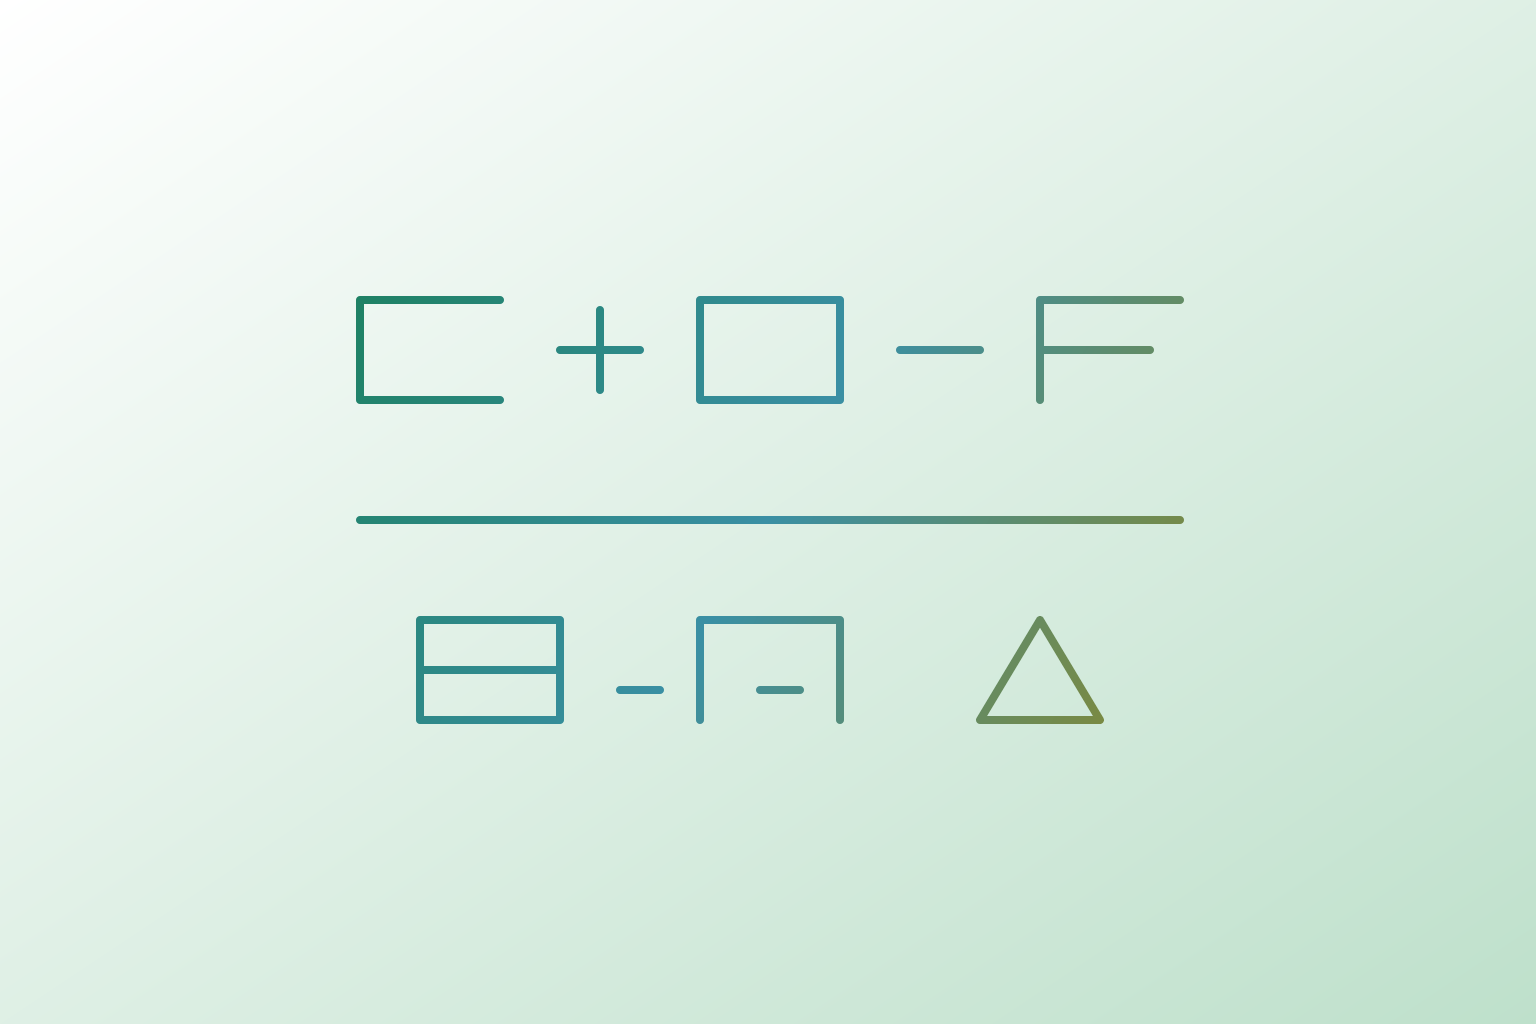
The formula is SG&A = Selling Expenses + General Expenses + Administrative Expenses. Some companies combine general and administrative costs into one G&A line, presenting two components. The total does not change. The three-bucket view, however, separates the cost of winning revenue from the costs of maintaining infrastructure and running the organization.
Selling expenses pay for winning customers and making sales. They include sales salaries and commissions, advertising, content production, agency retainers, campaigns, trade shows, sponsorships, and related travel. Sales travel, client entertainment, CRM tools, demo products, and free samples also belong here. In product businesses, outbound shipping and distribution cover getting goods to buyers. Selling is generally the most variable bucket because much of it moves with revenue.
General expenses maintain the physical and digital workplace. Office rent, utilities, internet, phone service, office supplies, furniture, maintenance, and repairs fall into this bucket. So do property and liability insurance and company-wide subscriptions for email, cloud storage, and collaboration. These costs tend to be relatively fixed, since rent does not fall when sales have a slow month.
Administrative expenses keep the organization functioning. They include executive compensation outside production or selling, finance, HR, and legal salaries, plus external accounting, legal, audit, and consulting fees. IT support, cybersecurity, recruiting, payroll processing, and HR administration also fit here. Depreciation on office equipment and furniture may appear here when not reported separately. These costs get a close look during cuts because they do not bring in revenue directly, though the business still needs the work done.
Liberty Media’s 2026 filing illustrates how broad the reported line can be. It includes personnel, legal, professional and advisory fees, bad debt expense, rental expense, information technology, insurance, maintenance, utilities, and office administration. Adding these amounts is easy, but deciding which costs belong in the total is the harder task.
What to Exclude and Why Misclassification Matters
The boundary starts with what the expense supports. As a starting test, a cost that would disappear if production stopped is almost certainly COGS, while one that would continue without sales is likely SG&A, though the cost’s role still needs examination. Sales commissions, for example, change with sales but are still selling expenses. Variability alone does not turn an expense into a production cost.
A bakery’s flour, sugar, baker wages, and oven maintenance belong in COGS, while storefront rent, marketing, and the owner’s salary belong in SG&A. For a software company, hosting and customer support directly tied to service delivery belong in COGS. Its sales commissions, office space, legal fees, and executive compensation belong in SG&A. The same logic excludes direct production labour, raw materials, and manufacturing overhead tied to the production facility.
Misclassification changes the story the income statement tells. Moving selling or marketing costs into COGS compresses gross margin, making delivery look more expensive than it is. Moving production costs into SG&A does the reverse, inflating gross margin and understating the cost of serving customers. The total expense may be unchanged, but the apparent source of inefficiency moves. An audit correction can reverse that distorted picture.
Other exclusions depend on reporting position. R&D that is reported separately stays outside SG&A, while interest and taxes sit below operating income. Depreciation needs particular care because some companies report it separately and others allocate it across COGS and SG&A. Those differences can complicate comparisons even within one industry.
FASB’s ASU 2024-03 requires public companies to disclose total selling expenses and, in annual filings, their definition of those expenses. It applies to annual periods beginning after December 15, 2026, and interim periods within fiscal years beginning after December 15, 2027. Calendar-year public companies first apply it in fiscal year 2027.
Calculating SG&A and the SG&A Ratio
The calculation begins by adding the correctly classified costs for the same period. Salary and commission costs come from payroll, items such as rent and professional fees come from accounts payable, and travel and other employee spending come from an expense platform. Each amount goes into the selling, general, or administrative subtotal where it belongs. Those subtotals then combine into total SG&A. The source system does not determine the expense category.
In the small consulting firm example for Q4 2025, field labour, materials, and equipment sit in COGS. Sales salaries, commissions, advertising, events, sales travel, and client meals form the selling subtotal. Finance, HR, and legal salaries join rent, utilities, company-wide software, professional fees, insurance, and licenses in the combined G&A subtotal. Adding selling to G&A produces the period’s SG&A total. The example uses two reported components without changing the underlying formula.
The next calculation is SG&A Ratio = Total SG&A ÷ Net Sales × 100. Dividing the example’s SG&A by quarterly revenue and multiplying by 100 produces a ratio of roughly 15.9%. This gives the overhead total a revenue base. A dollar amount alone cannot show whether spending is proportionate to the business supporting it.
The second example keeps all three buckets separate. Selling expenses are subtotaled first, general expenses next, and administrative expenses separately, before the three amounts are added. Dividing that total by revenue and multiplying by 100 produces a ratio in the same range. The supplied examples do not give the underlying dollar amounts, so a more detailed numerical calculation would require those inputs.
The ratio makes comparisons across periods and company sizes possible, but it cannot repair misplaced expenses. The percentage is only as reliable as the classification behind it.
SG&A Ratios by Industry and Stage
There is no universal “good” SG&A ratio. Wholesale trade tends to be at the low end because it needs a lot of assets, has thin margins, and has little selling overhead. Manufacturing is generally moderate because production dominates its cost structure. Retail tends to be higher, with commissions, advertising, and storefront rent adding to the expense base. Comparing these models without that context misattributes differences in business model to differences in management quality.
Professional services often have materially higher ratios because relationship-driven revenue requires heavy investment in people. Software and SaaS sit among the highest because customer acquisition and retention are central cost levers. Pharmaceuticals and some healthcare sectors can be comparably high or higher. A large ratio is therefore not, by itself, evidence of wasteful spending. It may reflect how the business earns its revenue.
Company stage changes the baseline as well. Mature companies usually have more revenue over which to spread fixed SG&A, while early-stage companies may spend heavily to win customers before revenue catches up. HubSpot’s fiscal 2025 SG&A represented a materially higher share of revenue than Datadog’s fiscal 2025 SG&A. Both are software businesses, but their growth and go-to-market investment differ.
Benchmarks are reference points. A ratio above an industry midpoint can support growth, while a low ratio can reflect underinvestment in sales or administration. Even then, the total ratio does not show how much spending is fixed and how much adjusts with revenue.
Fixed Versus Variable SG&A Costs
Two companies can report identical SG&A ratios and face different risks when sales fall. Office rent, executive salaries, insurance premiums, and company-wide software subscriptions stay roughly the same as sales volume changes. A business with a high fixed share has predictable costs in stable conditions but less room to adjust during a downturn, because revenue can decline faster than these costs can be reduced. The ratio shows the burden, but not how much of it is fixed.
Variable SG&A moves more closely with revenue. Sales commissions, performance bonuses, some advertising, and event costs fall into this group. Selling expenses usually contain the largest variable share, although not every selling cost behaves alike. Direct selling costs such as commissions, shipping, and transaction fees are variable by their nature. Advertising, sales salaries, and CRM subscriptions are more fixed and require deliberate action to adjust.
Commission-based compensation rather than high base salaries can reduce downside exposure, but it also introduces earnings volatility as sales rise. Lower fixed commitments make one part of the cost structure more flexible without eliminating selling costs.
The same mix shapes the benefits of growth. When most SG&A is variable, spending tends to rise with revenue, so the ratio stays roughly the same. With mostly fixed SG&A, revenue growth can compress the ratio because the expense base does not rise in step. That is operating leverage, which helps explain mature companies’ profitability at scale. Understanding the mix makes the calculation useful for decisions rather than just for filling an income-statement line.
Using SG&A for Better Decisions
Investors and lenders use the SG&A ratio to assess operating efficiency. Spending more than peers can point to overhead that holds down profits, while a falling ratio can show that a business is keeping costs in check as it grows. Those readings depend on the context already established, including business model, company stage, reporting choices, and fixed costs. Accurate classification gives the percentage a sound foundation.
Internally, the buckets point to different management questions. When selling expenses rise relative to revenue, managers need to look at sales productivity, including whether commissions lead to enough closed business. Rising general expenses raise a facilities or infrastructure question about the fixed cost base. When administrative expenses rise, managers need to look at how headcount and spending on vendors compare with growth. One total makes it harder to tell those problems apart.
The goal is the lowest sustainable cost for the capabilities the strategy requires. The selling-expense disclosure requirement reinforces the need to understand the components.
Classifying expenses gets harder when they come through more than one system. Payroll and rent may come in pre-coded, while travel, events, and mixed-use software licenses need a close look when they are entered. Expense management tools that integrate with payroll, accounts payable, and corporate card programs help address that classification risk. Ramp is built to surface and enforce those classifications at scale, supporting an accurate, audit-ready total. Consistent classification should be a routine part of the close process.
Methodology & sources
- What Is SG&A: Meaning, Formula & Examples
Covered the SG&A definition, the selling, general and administrative components, the formula and the ratio calculation that the article walks through.