
Procurement Spend Analysis Fundamentals
Spend analysis turns messy purchase records into negotiating leverage and compliance roadmaps.
Procurement spend analysis is the process of collecting, cleansing, classifying, and analyzing every dollar a company spends outside its own walls, so someone can finally answer the question every CFO has asked at least once: where did it all go, and can we get any of it back? Most teams treat this as a once-a-year report. The ones that actually save money treat it as a discipline they run on repeat.
Quick vocabulary check before going further, because these three terms get mashed together constantly. Spend data is the raw stuff: purchase orders, invoices, P-card charges, sitting in whatever system spat them out. Spend analytics is the technical work of pulling that raw stuff together and sorting it into categories. Spend analysis is what happens after: the interpretation, the "so what do we do about this" layer that turns a spreadsheet into a negotiation strategy.
None of this works if the underlying materials are a mess, and they usually are. Purchase orders live in one system, invoices in another, P-card transactions somewhere else entirely, contract terms buried in a shared drive nobody's opened since the renewal, expense reports in five currencies and at least two languages. It's a pile of mismatched feeds that were never built to talk to each other, not one clean feed. It's a pile of mismatched feeds that were never built to talk to each other.
Here's the difference it makes. A category manager walking into a supplier renewal with "I think we spent around $2 million with them last year" is negotiating from memory. A category manager who walks in with the exact number, three competing quotes on file, and a clear read on whether current pricing still holds up against the market is negotiating from a position of fact. Spend analysis is the thing that moves a team from the first version to the second.
And to be clear about what this isn't: it's not a dashboard someone glances at during budget season. It's a report that gets filed and treated as finished, only to demand the same work again the following December. It's not a fire drill procurement runs only when finance starts asking uncomfortable questions. Done right, it's a standing process that keeps producing usable intelligence, month after month, whether anyone's asking for it or not.
Why external spend is large enough to make analysis a strategic obligation
External spend, everything paid out to suppliers, contractors, and vendors, typically makes up somewhere between 60% and 80% of total revenue at most companies. That's the number that gets a CFO's attention fast. When the majority of a company's revenue is walking out the door to third parties, the quality of that outbound decision-making is a company-wide risk, not a mere procurement detail.
Operations and services spend alone runs at a substantial share of total revenue, based on Sievo's 2025 State of Spend research, which drew on a massive pool of actual enterprise spend across six industries. That's real transaction data, not a survey of opinions.
The same dataset shows how fast categories can shift without anyone noticing. Fleet spend jumped 33% across nearly every industry between 2022 and 2024. Cross-industry travel spend climbed 58% over a similar stretch. Inflation, higher financing costs, and travel demand snapping back after a period of steep decline all played a part. Neither number appears as a dramatic headline. They appear quietly, buried inside categories that everyone assumed were stable because last year's budget said so.
A category can look flat on paper and be running considerably hotter in reality, and without continuous analysis, procurement finds out after the budget's locked, not before, which is the trap. A category can look flat on paper and be running considerably hotter in reality, and without continuous analysis, procurement finds out after the budget's locked, not before.
There's a gap between wanting this and doing it, too. Procurement Magazine's coverage of the State of Spend research found that 31% of decision-makers, and 34% of senior procurement leaders, name improving reporting and analysis as a top priority for where they want procurement spending more time over the coming year. That's a lot of people agreeing this matters and a much smaller number actually restructuring their week around it.
Layer ESG reporting requirements on top and the stakes get sharper still. Companies increasingly need to know, with precision, who their Tier 1 suppliers actually are and what they're spending with each one, for external disclosure purposes. "Roughly" doesn't cut it anymore. Spend analysis has quietly become a compliance function as much as a savings function.
Step one: collecting spend data from systems that were never designed to talk to each other
Collection sounds like the boring part. It's actually where most spend analysis programs quietly fail before they even get started.
The full list of places data needs to come from is longer than most teams expect going in: ERP systems, e-procurement platforms, standalone purchase order records, invoices, P-card statements, the general ledger, expense management tools, data suppliers share directly, plus credit ratings and risk assessments for anyone doing supplier risk work alongside the spend work. Each system speaks its own dialect: different currencies, different date formats, different levels of detail, sometimes different languages entirely if the business operates across borders. Pulling all of that into one usable dataset isn't a formality on the way to the real work. It is the real work, at least at first.
Skip the people and the data gets skipped too. Department heads and business unit leads hold the context on spend that never touches a central procurement system, and if nobody asks them, entire chunks of indirect spend simply vanish from the analysis. The gap doesn't appear at collection. It appears later, at classification, when someone notices a category that should be six figures is showing up as a rounding error.
The usual suspects for what goes missing: tail spend from purchases made outside any central process, P-card transactions that never touch procurement at all, and subsidiary or regional spend that never made it into the parent company's ERP.
Miss enough of that and the downstream classification looks tidy, clean categories, clean numbers, but it's only describing a slice of what actually got spent. Every savings estimate built on top of it is quietly lowballing the real opportunity.
Step two: cleansing spend data so that the numbers can be trusted
Once the data's collected, it needs cleaning, and this is where the unglamorous, detail-obsessed work happens. Duplicate records get removed. Gaps in supplier names and codes get filled in. Typos and inconsistent abbreviations get fixed. The same office supply vendor showing up as "Staples," "Staples Inc," and "STAPLES-US" across three business units gets merged into one entity instead of three.
That merging step, sometimes called enrichment, matters more than it sounds like it should. Standardizing supplier records so a parent company and its subsidiaries show up as a single entity, rather than dozens of smaller ones scattered across the dataset, can completely change how concentrated a supplier relationship actually looks. A vendor that appeared to be ten small, low-risk suppliers might turn out to be one large, high-dependency relationship in disguise.
Trust is the real currency here, and it's fragile. If a category manager or a senior procurement executive finds even one obvious error in a spend report, that person will start second-guessing every number that follows, whether or not the rest of the data is solid. Cleansing is what keeps that from happening in the first place.
It's also why rushing toward AI without doing this work first tends to backfire. Data quality is consistently cited as a leading barrier to getting AI to work in procurement. That finding says something specific: AI doesn't fix messy inputs; it just processes them faster, mistakes and all. It just processes them faster, mistakes and all.
And cleansing isn't a one-and-done exercise, no matter how tempting that idea is. New transactions keep flowing in every week carrying the same old naming inconsistencies and gaps. Treat cleansing as a project with an end date, and the data quietly rots between one analysis cycle and the next.
Step three: classification, where raw data becomes a usable map of spending
Classification is where the clean data finally becomes something a human can act on. It groups suppliers and expenditures into a shared taxonomy, so the analysis can happen at the category and sub-category level instead of drowning someone in individual line items.
The taxonomy itself is a bigger decision than most teams give it credit for. Build one that mirrors the internal org chart and department budgets, and it'll make sense to whoever owns each budget line, but it'll hide sourcing opportunities that don't respect those internal boundaries. Build one around how the market actually supplies goods and services instead, and different insights start to appear, ones that map to where real leverage exists.
Practically, this means grouping every subsidiary of a parent supplier together, sorting spend lines into logical buckets like IT services, facilities, professional services, and raw materials, and figuring out what to do with the purchase that legitimately spans two categories at once.
Accuracy here is measurable, and practitioners widely report that AI-assisted classification outperforms older rules-based systems by a meaningful margin. But accuracy only means something relative to the taxonomy it's sorting into. Classify perfectly into a bad structure, and the output is still useless.
Tail spend is the classic casualty. Thousands of small, irregular purchases, the kind that never go through a formal procurement process, are the hardest transactions to classify cleanly, which makes them the easiest to just leave out. That's a mistake, since tail spend commonly runs around 20% of total spend at most organizations. Ignore it, and a fifth of the picture goes missing before analysis even starts.
Skip classification, or do it poorly, and the distortions compound. A supplier operating under ten different name variants looks like ten separate small vendors instead of one sizeable relationship worth negotiating harder on. A category being managed independently in three different regions can look like a competitive, fragmented market, when it's actually a single vendor collecting the same margin three times over under three different labels.
Step four: the four types of analysis that turn a classified dataset into procurement strategy
With clean, classified data sitting in front of them, procurement teams can finally ask the questions that actually matter. Four types of analysis tend to do most of the heavy lifting, and each one pulls a different answer from the same underlying dataset.
Supplier spend analysis looks at who the money's going to: how concentrated each relationship is, and where fragmented purchasing across departments is quietly costing negotiating leverage. This is the analysis behind that earlier example, walking into a renewal with the real number instead of a guess.
Category spend analysis flips the lens to what's being bought: where consolidating suppliers or introducing more competition could bring costs down, and which categories have quietly ballooned without anyone keeping watch.
Contract compliance analysis checks actual buying behavior against what was actually negotiated. It reveals off-contract spend, contracts that expired months ago while purchasing quietly continued at the old (or worse, a higher) rate, and maverick buying that's slipping past agreed terms entirely.
Tail spend analysis takes on that long, messy tail of low-value, high-frequency purchases that dodge procurement's usual channels. It typically represents around 20% of total spend, and while each transaction is small, the sheer volume eats up processing time and hides consolidation opportunities that would otherwise be obvious.
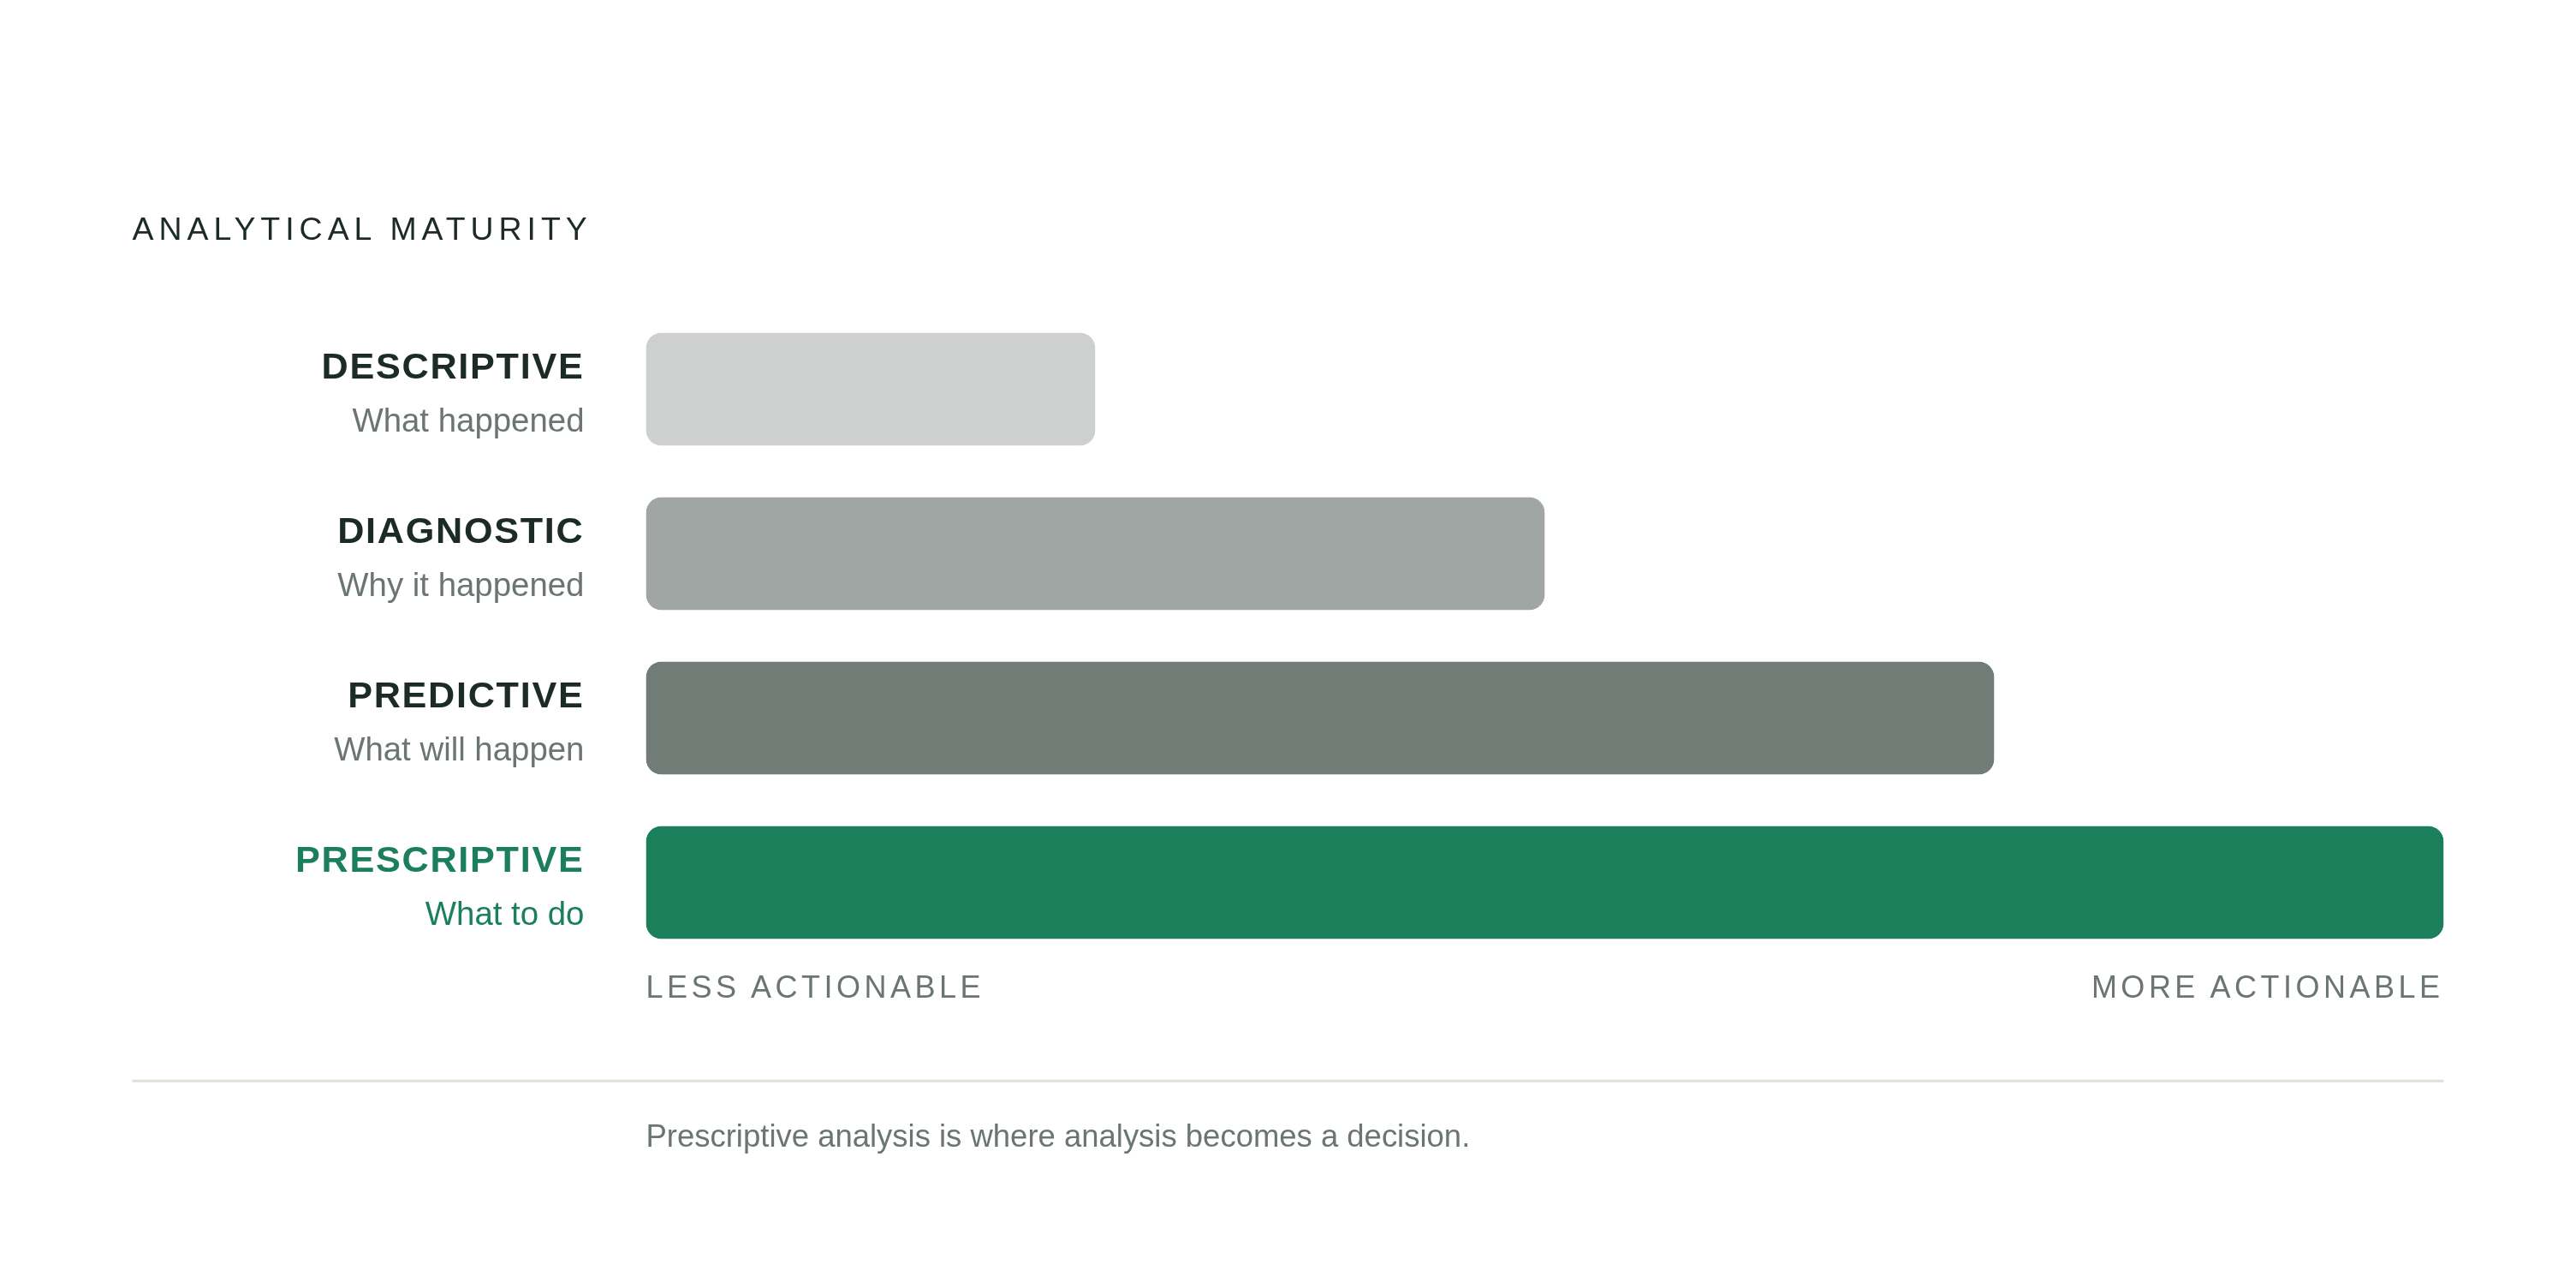
Beyond the four types, there's a maturity ladder the analysis itself climbs. Descriptive analysis explains what happened. Diagnostic analysis explains why it happened. Predictive analysis starts forecasting what's likely to happen next. Prescriptive analysis tells someone what to actually do about it. Move up that ladder, and the intelligence becomes a decision rather than a history lesson.
The stakes are concrete. Research from Suplari puts the cost of poor spend visibility at 3% to 11% of total spend annually, lost to duplicate suppliers, inconsistent pricing across the same vendor, missed volume discounts, and compliance violations nobody caught in time. Rigorous analysis tends to surface savings opportunities in the 5% to 15% range, through supplier consolidation, tighter compliance enforcement, better demand management, and honest rate benchmarking against the market. That's not a rounding error. For a company spending hundreds of millions externally, that range is the difference between a good year and a great one.
What world-class spend management looks like in practice, and where most teams sit
"Spend under management" is the single best gut-check metric for how mature a procurement function really is. It measures what share of total addressable spend is actually captured, cleansed, classified, and actively managed rather than floating around unmonitored. Benchmarks reported by varisource.com, citing 2026 data, put world-class performance above 90%, with top performers reaching 92%.
Compare that to Procurify's 2026 Benchmark Report, built on a huge volume of anonymized spend data, which found average purchase order coverage was 76.9% in 2025, up from 71.8% in 2023. Progress, sure. But that also means roughly a quarter of transactions at the average company still happen with no formal PO process attached at all, which is a lot of spend flying under the radar.
The payoff for closing that gap is well documented. The Hackett Group's research on Digital World Class procurement teams shows they generate several times greater return on investment than their peers, run at 19% lower cost, and deliver more than double the cost savings as a share of total spend. None of that comes from owning fancier software. It comes from applying analysis systematically, every cycle, instead of occasionally.
Supplier fragmentation tells its own story, and it varies wildly by industry. Sievo's 2025 State of Spend data (again, real transaction data, not a survey) shows services and retail organizations averaging 8,100 suppliers per billion dollars of spend, working out to around $123,000 spent per supplier. Infrastructure and utilities companies average just 2,500 suppliers per billion, or about $402,000 per supplier. A services company juggling that many small suppliers has a very different consolidation opportunity sitting in front of it than a utility does, and the analysis needs to reflect that instead of applying one generic playbook everywhere.
The real dividing line, though, is the timing, not the size of the number. It's the timing. A team running analysis once a year finds out about spend drift after the budget's already locked and the sourcing decisions already made. A team running it continuously sees the drift coming before the renewal, before the price hike, before the sourcing event even gets scheduled.
Where AI changes the mechanics of spend analysis, and where data quality still determines the ceiling
Spend analytics is currently the most widely deployed AI use case in all of procurement. The Hackett Group's 2025 research found the majority of organizations already using some form of AI for spend classification specifically. This is the leading edge of the function now, not an experimental corner of it. It's the leading edge.
Even so, there's a wide gap between interest and actual deployment. 2026 State of AI in Procurement benchmarks found 92% of CPOs are planning or actively assessing AI capabilities, roughly half are running pilots, and only a small fraction have anything deployed at real scale. Procurement's real challenge right now is turning scattered individual experiments into a governed process that actually runs in production, not proving AI can help. It's turning scattered individual experiments into a governed process that actually runs in production.
Where AI earns its keep most clearly is classification accuracy. It consistently beats older rules-based systems, and for organizations wrestling with sprawling taxonomies and supplier names that were never standardized to begin with, that improvement is most visible and most measurable in classification accuracy.
There's also a workload problem AI is being asked to solve whether it's ready or not. The Hackett Group's 2026 Procurement Agenda study projects workloads rising 8.0% in 2026, while headcount drops 0.9% and budgets shrink 0.4%. That gap, more work, fewer people, less money, can't be closed by simply asking everyone to work a little harder.
That same Hackett Group research puts the data quality barrier at roughly three-quarters of organizations. AI can't classify data that was never collected in the first place, and it doesn't fix errors sitting in an uncleaned dataset. It just runs those errors through the system faster and with more confidence. Gartner's 2025 research places generative AI in procurement squarely in the trough of disillusionment: ROI has been uneven, and a lot of organizations are landing well short of what they expected going in. Teams pouring budget into AI before fixing collection and cleansing are, more or less by definition, the ones living out that exact pattern.
Vendors are still building toward the vision regardless. Coupa expanded its Navi AI agent portfolio in May 2025 to offer real-time insights and automated workflows. SAP folded generative AI into its Joule copilot starting in 2023, with expanded procurement-specific capabilities, including natural language interfaces, reaching general availability in 2025. Zycus launched Zycus Pay in September 2025, building B2B payment capability directly into its procurement platform. The direction is consistent across all three: automate the repetitive analytical grunt work, but leave the strategic judgment, what to actually do with the insight, in human hands.
The metrics that tell you whether spend analysis is working
Spend under management is the headline number to track above all others. It answers the most basic point: what share of total addressable spend is actually captured, classified, and being actively managed? The 92% spend-under-management figure marks world-class performance on that metric, while the 76.9% PO coverage average reflects a related but distinct measure of where most teams are actually starting from today.
Contract compliance rate is the second number to watch closely, since it measures actual spend against what was negotiated. This is the metric that reveals whether analysis is changing how people actually buy things, or just quietly documenting bad behavior after the fact.
Supplier concentration, how much total spend flows through the top few suppliers in each category, does double duty. It flags consolidation opportunities and single-source risk in the exact same number, which makes it efficient to track even if it's slightly uncomfortable to look at.
Then there's the gap between savings identified and savings realized. Analysis routinely reveals that 5% to 15% opportunity range mentioned earlier, but if none of it turns into an actual sourcing action, the report was decoration, not strategy.
Cost savings as a percentage of total spend ties the whole thing together. Hackett Group's Digital World Class benchmark shows those top-performing teams delivering more than double the savings by this measure compared to peers. Track this figure every year, and there's a direct, defensible line from the analysis discipline itself to a number the CFO already cares about.
How often a team measures matters almost as much as what it measures. Check spend under management quarterly, and classification drift gets caught early, before it compounds into a real problem. Check it once a year, and a team's just discovering issues on the same slow schedule as the file-it-and-forget-it teams this whole discipline exists to outperform.
A savings claim without its baseline is just a claim, not evidence. Any team reporting "we saved X%" without showing the starting spend, the method used to get there, and what specific action actually drove the number, is producing exactly the kind of report that erodes trust in whatever comes next.

