
Driver-Based Financial Modeling
Operational drivers replace guesswork with real-time forecasting.
Driver-based financial modeling swaps out the old habit of stretching last year's numbers into next year's guess. A small set of operational drivers, volume, price, headcount, utilization, does the math instead, and every downstream number updates the moment one of those drivers moves. That's the whole idea, and most companies still haven't gotten there.
How driver-based forecasting and driver-based budgeting serve different purposes
Budgeting and forecasting get treated like synonyms. That's the mistake, and it's where most planning headaches start.
Driver-based budgeting locks in your driver assumptions once a year. That locked version becomes the target, the thing your team gets held to. Driver-based forecasting takes the same drivers and keeps them moving, swapping in actuals as the year plays out, so the estimate never goes stale. Budgeting freezes a number until the next cycle. Forecasting produces a rolling estimate that updates as real numbers land.
A SaaS company watching churn creep up mid-quarter sees it hit the forecast immediately, since churn is a live driver feeding it. The marketing budget, though, was set months ago against an expected customer acquisition cost, and it won't move until someone formally reallocates it. Both tools are doing their job. Budgeting holds people accountable to a number. Forecasting tells you where you actually stand. The mistake isn't picking one over the other, it's treating either as a substitute when they need to run side by side.
How to select the right drivers and structure the causal chain
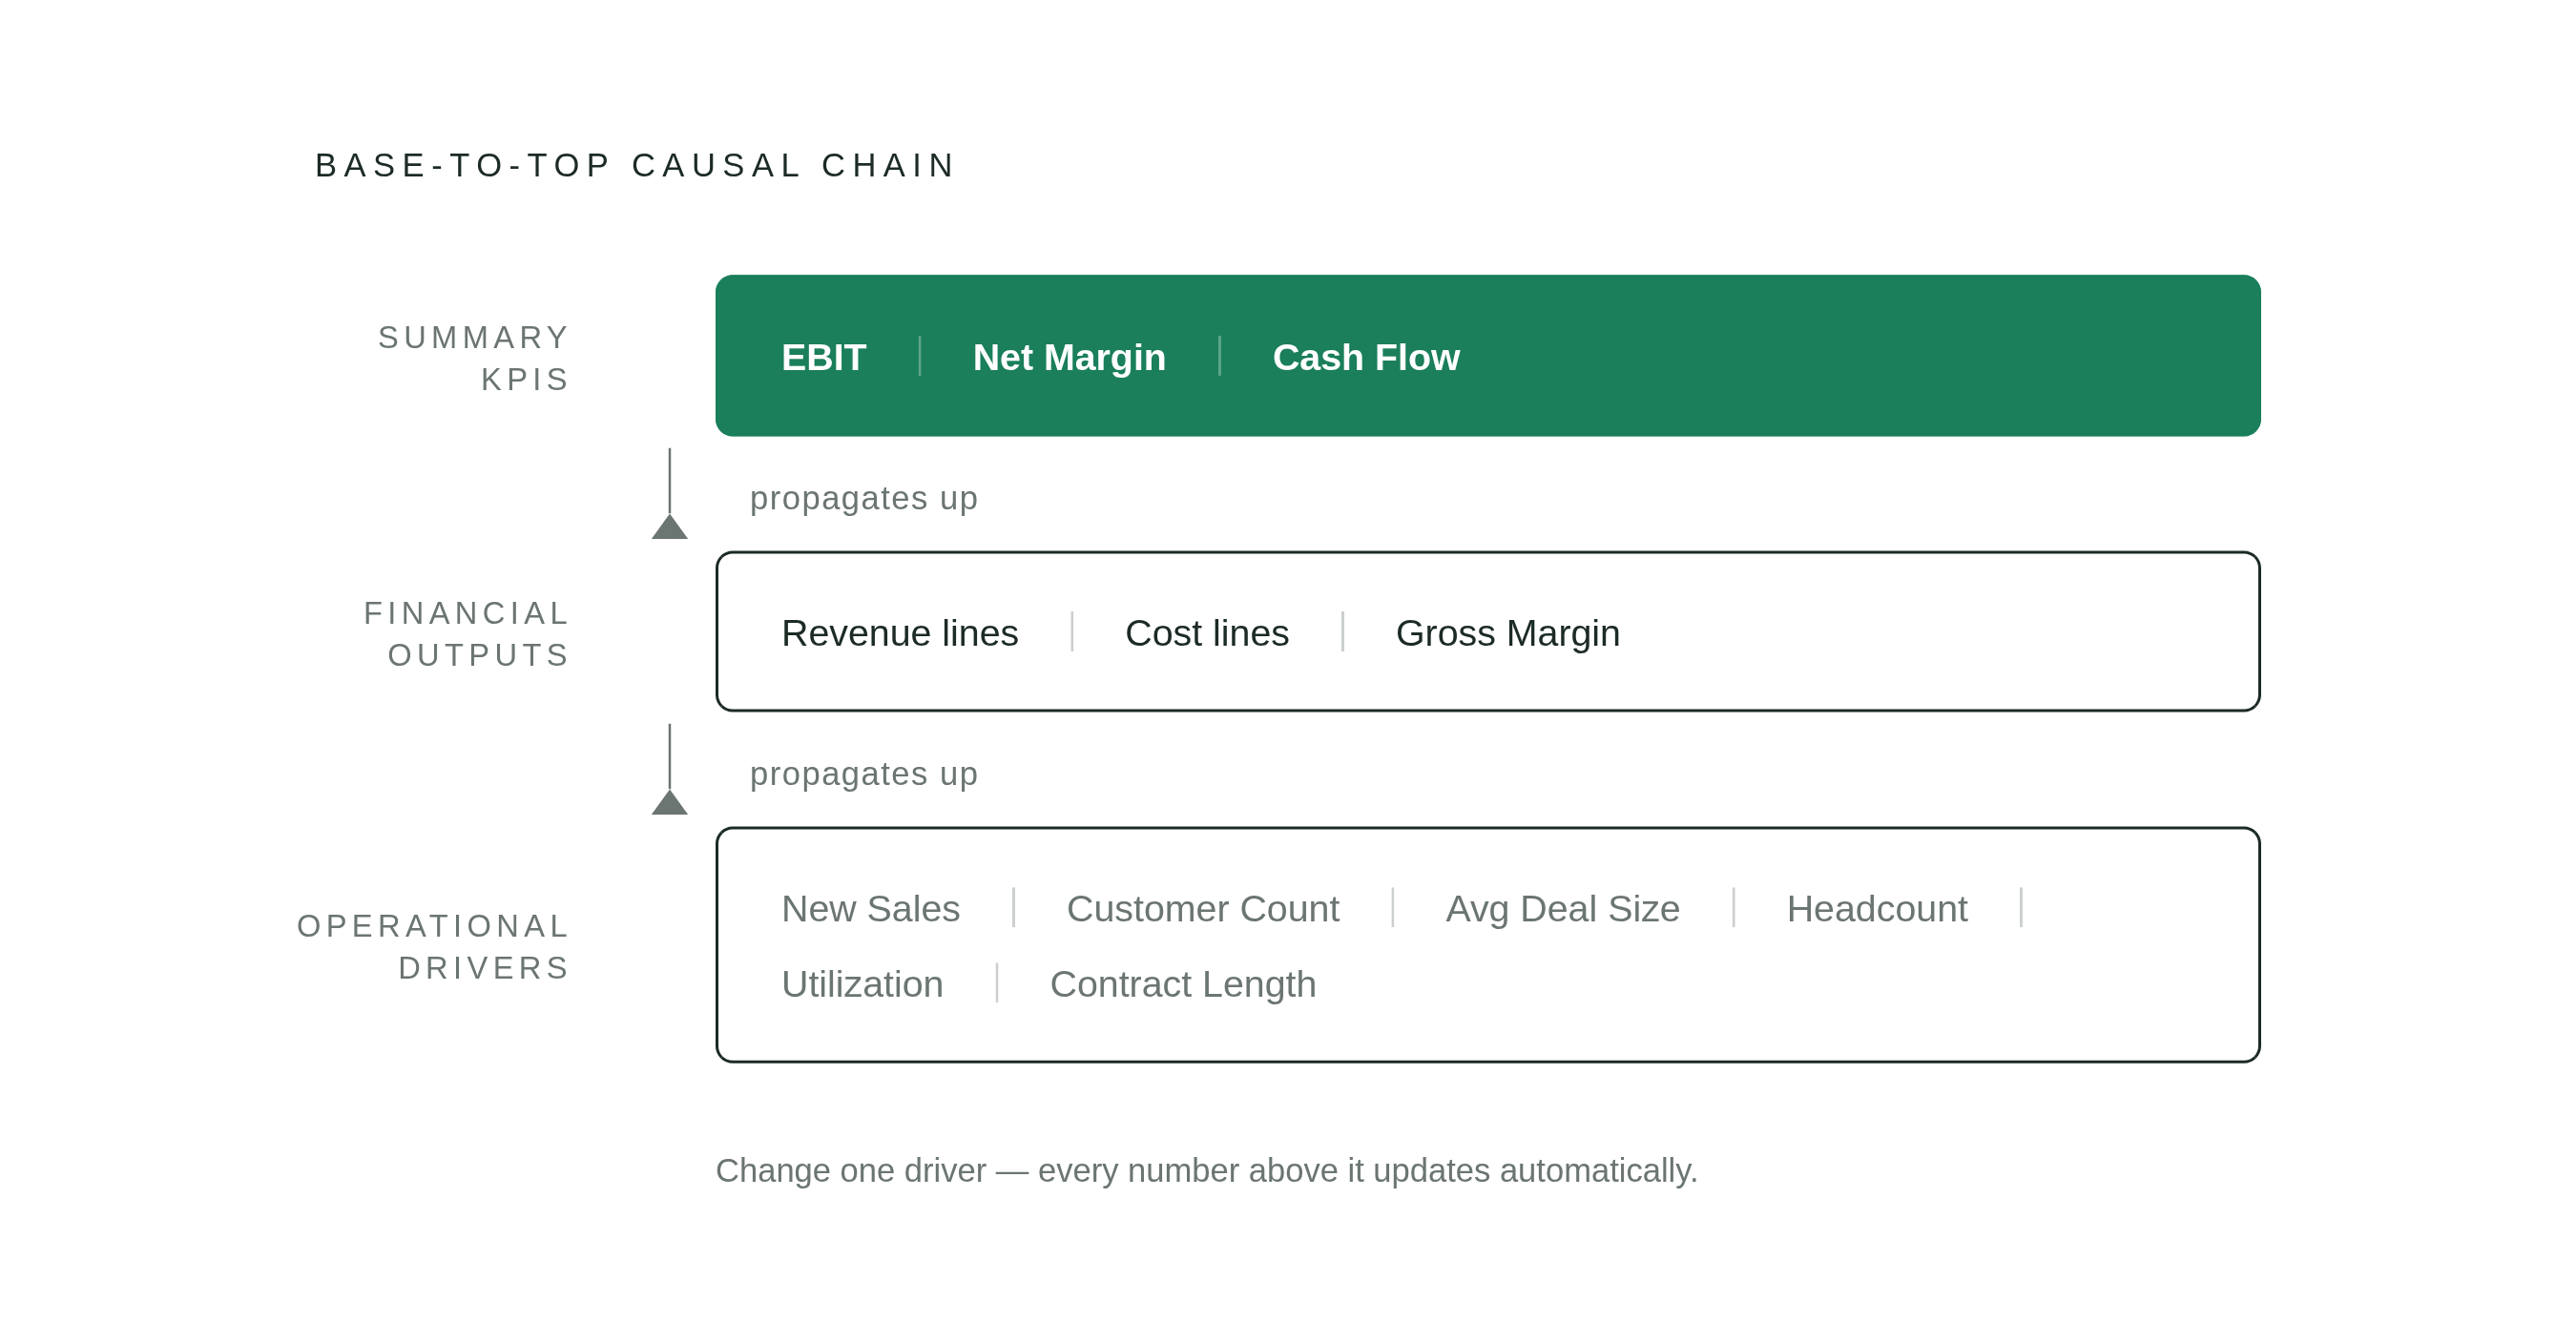
Picking drivers is the part everyone underrates, and a shocking number of models quietly go wrong here before a single formula gets built.
The bar for a driver isn't "seems related" or "the VP of Sales likes tracking it." A driver earns its spot with real, measurable predictive power, something traceable in the data, not something felt in the gut. Most business performance traces back to a small handful of drivers, and that's the filter. Adding more past that point doesn't make the model smarter. It makes it slower and muddier, and someone still has to explain the extra rows in a meeting nobody wanted to schedule.
The classic trap is mistaking a metric that moves alongside revenue for a metric that actually moves revenue. Website traffic might climb every time sales climb, but traffic isn't causing the sales, some third factor is probably driving both. Confuse the two and the model looks sophisticated right up until it forecasts something completely wrong, usually right before a board meeting.
A workable driver structure stacks in three layers. The base is operational: new sales, customer count, average deal size, headcount by department, utilization rates, contract length. The middle is financial: the revenue lines, cost lines, and gross margin those operational numbers produce. The top is the summary KPIs leadership watches, EBIT, cash flow, net margin. Each layer feeds the next, so a change at the base ripples all the way up without anyone manually pushing it there.
There's also a useful split between drivers a company controls and ones it doesn't. Workforce productivity, sales performance, operational efficiency: those are internal, and a business can push on them directly. Inflation, regulation, whatever a competitor decides next: those are external, and the only real move is planning around them. The two bleed into each other constantly. An inflation spike raises the cost of raw materials, which then forces an internal decision about pricing. External shocks land, internal levers respond.
None of this works as a solo spreadsheet exercise, and treating it like one is the second-biggest mistake teams make. Before anyone builds a formula, the business needs to agree on what the model is for, what's in scope, what's deliberately left out, and who signs off when something changes. Skip that step and the model becomes one analyst's private theory of the business: technically correct, practically ignored by everyone who didn't build it.
Building the model: how cause-and-effect chains translate into working formulas
At its simplest, revenue is volume times price. Volume breaks down further into sales capacity times win rate times market demand. That's the whole engine in one line, before anyone starts nesting formulas into a spreadsheet.
Costs follow the same logic, running through different drivers. Headcount cost isn't a flat number, it's tied to a hire date, so payroll and benefits show up exactly when that person starts. Commissions get tied directly to bookings, so the cost line moves the second the sales plan does. Marketing spend often gets pinned to a pipeline target or a CAC assumption rather than a fixed dollar figure someone picked in November. Production and delivery costs scale off whatever volume driver already runs the revenue side.
Here's what that looks like in motion. Change one hiring date, and the headcount schedule shifts. Payroll cost shifts with it. Revenue capacity adjusts because the new hire changes sales capacity, and the cash projection updates right along with everything else, with nobody touching four separate tabs to make it happen.
The general shape holds across most businesses: units times price per unit driving revenue, costs broken into headcount comp, marketing spend, production volume, and key input costs. The more steps it takes to calculate a driver, the more room there is for the number to quietly go wrong somewhere in the chain. Simpler paths to a number hold up better than clever ones, almost every time.
Spreadsheets eventually can't carry this weight, and that's the real reason so many of these models outgrow Excel. A spreadsheet's logic lives in whoever built it. Ask a different team member why one cell references an adjacent cell instead of another, and there's a real chance nobody remembers, including the person who wrote it six months back. Purpose-built planning software keeps that logic visible and auditable across the team, instead of trapped inside one person's mental model of their own formulas.
Applying driver-based models specifically to B2B SaaS revenue
SaaS is close to the ideal use case here, mostly because the business already hands you the drivers. Subscription revenue comes pre-sliced into components, so nobody has to invent them.
Build the revenue model from the ground up. New MRR is driven by lead volume, conversion rates, and average contract value. Expansion MRR covers upsells, cross-sells, extra seats, the engine behind net revenue retention pushing past 100%. Contraction MRR tracks downgrades and reduced usage. Churned MRR is revenue lost to outright cancellations. Net MRR is New plus Expansion, minus Contraction, minus Churned. Simple arithmetic, but each input is its own driver, tracked and updated on its own schedule.
The benchmarks that matter here are the ones tied to valuation, not the ones that just sound impressive. SaaS Capital pegs the median private SaaS valuation multiple at 4.8x ARR, but companies with strong growth and retention pull 8 to 12x. Retention, the same driver feeding the revenue model above, is directly moving what the company is worth. Tie headcount to hire dates and commissions to bookings, and the cost side updates itself right alongside the revenue side. No separate headcount spreadsheet running in parallel and slowly drifting out of sync with everything else.
How driver-based models make scenario planning a routine operation rather than a rebuild
Ask a static budget "what happens if we push hiring back a quarter?" Honestly, the answer is to rebuild the whole thing, or keep a second copy around just in case. Neither is a good use of anyone's Tuesday.
A driver-based model handles that same question by changing one input. Move the hiring driver, and the model spits out a revised P&L, a new headcount schedule, and an updated cash projection, all in the time it takes to hit enter.
That's different from sensitivity analysis, which isolates which single driver swings the outcome the most, so leadership knows where to focus and where the numbers are safe to ignore. Scenario planning goes bigger: modeling a handful of genuinely different futures, a high-inflation environment against a sudden market disruption, not just nudging one variable around a single base case.
The bigger shift shows up in the conversation itself. Once the model runs on drivers, the discussion turns toward operational activity, the actual value chain of the business, instead of the usual walk through financial results after the fact. Finance stops explaining what already happened and starts helping leadership figure out what to do next. That's the strategic seat FP&A has been trying to earn for years, and driver-based modeling is what actually gets it there.
Why adoption remains low despite the benefits being well established
Given all that, the obvious question is why more companies aren't doing this already. Only about 9% of organizations run a fully driver-based model, and the gap has nothing to do with people doubting the approach. It comes down to how hard the setup genuinely is.
Data quality trips up a lot of teams early, and it's the first place things fall apart. Nearly half of FP&A professionals surveyed name it as a major obstacle. If sales, marketing, and ops each track numbers their own way, the driver relationships built on top of that data are shaky before the model even exists, no matter how clean the formulas look afterward.
Alignment is the second wall most teams hit. Gartner's research found that only about 3% of companies have strategic, operational, and financial planning fully lined up and working together. Driver-based modeling needs exactly that kind of alignment to function, so most companies are building on a foundation that isn't there yet.
Add in the driver-selection problem from earlier, too many drivers muddies things, too few misses the real business, correlation dressed up as causation produces a model that looks rigorous and forecasts badly, and it's not hard to see why teams stall out. There's a cultural piece too. Business leaders who grew up submitting line items to finance don't love being asked to agree, out loud, on cause and effect, in a room, with their name attached to the assumption. Excel's opacity problem doesn't help either. When the model's credibility depends on the one analyst who built it, that's a fragile kind of trust to build a company's planning on.
None of this argues against doing the work. It's a map of exactly where the work gets hard, which is a far more useful thing to have before starting than a pep talk.
A practical sequence for implementing driver-based planning without overbuilding
Start narrow. Name the handful of factors that actually move revenue, margin, or cash, not every metric that happens to live on a dashboard somewhere. Apply the 80/20 filter right away: chase the drivers that explain most of the variation, and resist the urge to fold in every department head's pet number just to keep the peace.
Data collection has to be cross-functional from day one. Sales pipeline, marketing conversion rates, operations throughput, HR headcount schedules: finance doesn't own most of this data, so getting it means actually going and asking the people who do.
Before any formula gets built, the cause-and-effect logic needs sign-off from the people who run those parts of the business, not a theory finance derives quietly in a back room and presents as settled fact. Then test it against reality. Run the proposed driver relationships against real historical periods and check whether they would've predicted what actually happened. Refine before deploying, not after the first forecast embarrasses everyone.
Scope needs to be written down plainly: what the model covers, what it leaves out on purpose, and how that gets communicated to the people who'll rely on it. The work doesn't stop at launch, either. Drivers that predicted performance well in one environment can lose their power the moment conditions shift, so someone has to keep checking, on a schedule, not whenever there's spare time.
The case for doing this properly rather than rushing it isn't a matter of taste. It shows up directly in the forecast-quality numbers covered next.
What good looks like: the forecast accuracy and planning quality gains organizations actually see
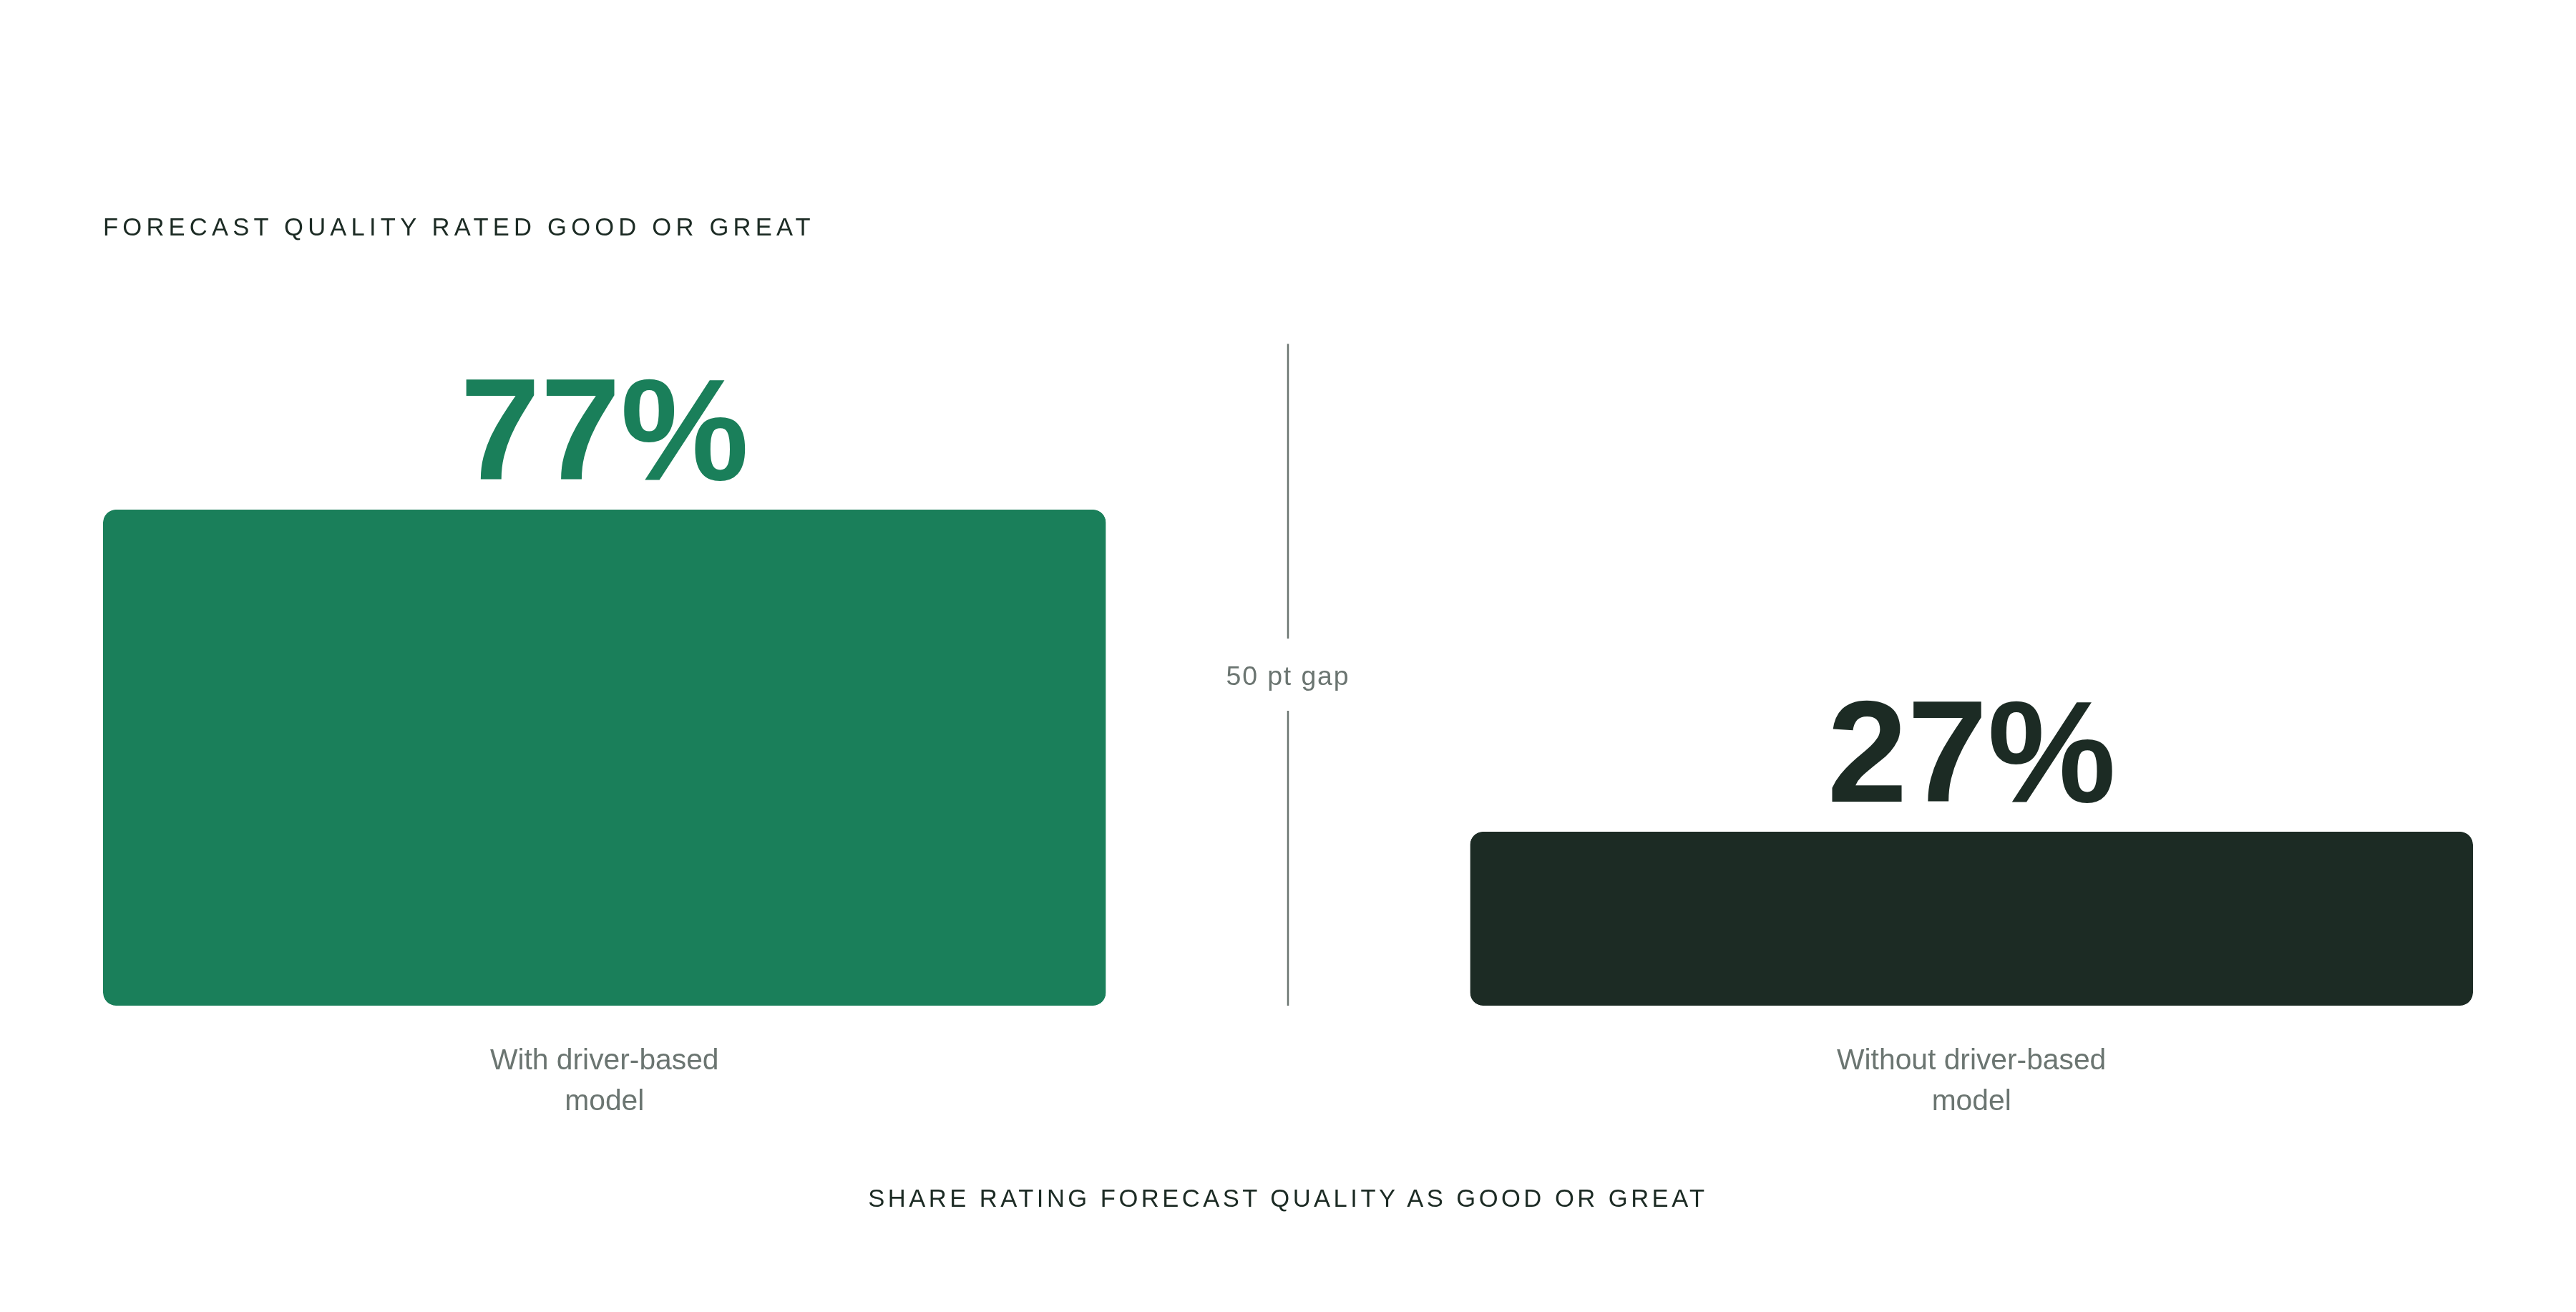
77% of organizations running driver-based models rate their forecasts as good or great. Only 27% of organizations without one say the same. That fifty-point gap is worth sitting with: three out of four teams running driver-based models trust their own forecasts, and barely one in four teams without one can say that, which is a strange thing to accept as normal for as long as most finance teams have.
Forecast accuracy often jumps by 50% or more once a driver-based approach replaces the old line-by-line method. Speed changes too. A model that reacts in real time skips the rebuild cycle that turns most static budgets into ancient history within a few months of getting approved.
Transparency improves in a specific, concrete way. Variance analysis stops being a hunt through line items and becomes a question of which driver moved and why. Finance can explain a miss in terms a business unit leader actually acts on, not accounting language that needs translating first. Rolling forecasts, once too labor-intensive to sustain past a quarter or two, become genuinely feasible, since the model doesn't need rebuilding every time someone wants an update.
The real shift is the one already mentioned above: conversations move from reporting what happened to figuring out what to do about it. That's finance earning a seat in the actual decision, not narrating the outcome after someone else already made it.
How AI and purpose-built planning tools are changing what driver-based models can do
The AI-powered FP&A software market was valued at $629.0 million in 2025, and it's projected to reach $4,793.7 million by 2033, growing at a 28.9% compound annual rate. That's not a market testing the waters. That's a market building infrastructure it expects people to depend on for a decade, and the money is arriving well ahead of the workflow habits.
Nearly 60% of CFOs plan to raise finance-function AI spending by 10% or more heading into 2026, according to Gartner's CFO budget research. The demand is coming from the top of the org chart, not creeping up from analysts experimenting on the side after hours.
And yet spreadsheets aren't going anywhere fast. Around 96% of FP&A teams still plan in Excel, per a 2025 AFP survey. That gap, big investment plans sitting next to near-universal spreadsheet use, is exactly where the adoption risk piles up. AI adoption in finance jumped from 37% in 2023 to 58% in 2024, holding close to that level, 59%, in the most recent Gartner survey. The shift is real. It's just recent, which means most of finance is mid-transition, not on the other side of it.
What AI actually adds to a driver-based model is far from magic. It's speed and pattern recognition, and the distinction matters. Anomaly detection tools, Planful Predict among them, flag an expense line drifting from its historical pattern before anyone on the team would notice scrolling through a report. Other tools watch for signs that a driver-outcome relationship has shifted, the kind of quiet breakdown that used to only get caught months later when the forecast missed badly, and surface a suggested adjustment before that happens. Someone still has to decide whether the suggestion makes sense. Catching the drift early, before it compounds into a forecast nobody trusts, is the whole game.

